
A metric in Google Analytics is a quantitative measurement of data that shows how your website is performing. It gives you clear numbers you can use to judge what’s working and what needs attention.
In this guide, I’ll show you what Google Analytics metrics are and how you can use them to make smarter decisions for your site.
What is Google Analytics?
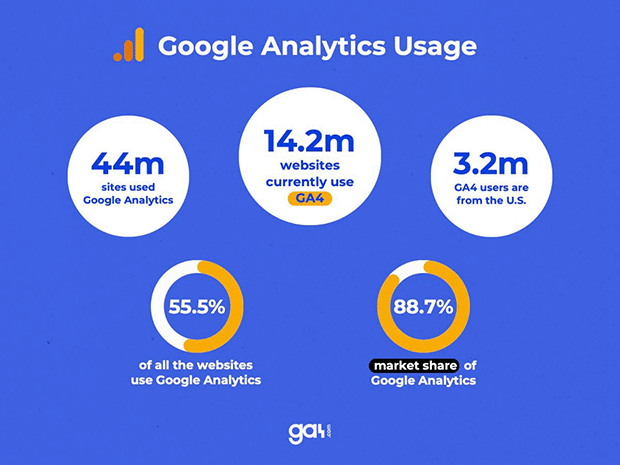
Google Analytics is a web analytics tool that shows how people use your website. It tracks visits, pages viewed, and how users find your site, giving you the insights you need to improve your online presence.
In fact, with over 88.7% market share, it’s the most popular choice for website analytics.
For more details, see our take on the pros and cons of Google Analytics.
What Is a Metric in Google Analytics?
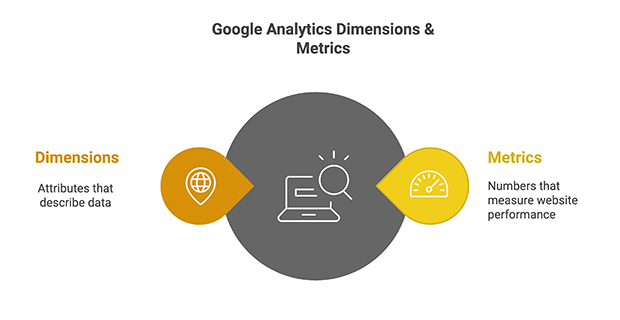
Metrics in Google Analytics are numbers that measure specific aspects of your website’s performance. They’re like the gauges on a car’s dashboard, showing you how your website is running.
For example, “pageviews” is a metric that counts how many times people look at your web pages. “Average time on page” measures how long visitors typically spend on a page.
Metrics work alongside dimensions, which provide context. If metrics are the “what,” dimensions are the “where” or “which.”
For instance:
- Metric: Number of sessions (visits to your site)
- Dimension: Source (where those visits came from, like Google or Facebook)
Understanding both metrics and dimensions helps you dig deeper into your data. For example, knowing your overall bounce rate isn’t as useful as knowing the bounce rate for specific landing pages. This information helps you focus on improving the right parts of your website.
Pro Tip: To measure your data, you’ll need to set up GA4. Here’s a simple guide on how to add Google Analytics to your website.
Key Metric Categories in Google Analytics
Google Analytics offers many metrics to help you understand your website. To make sense of this data, it’s helpful to group them into categories. Let’s look at the main types of metrics you’ll see and how they can help you improve your site.
User Metrics
User metrics help you understand who’s visiting your site and how they’re interacting with it. These numbers give you a clearer picture of your audience and how well your site is performing.
Here are the key user metrics to watch:
| Metric | What it Means | Why it Matters |
|---|---|---|
| Number of Users | How many people visited your site | Shows if your audience is growing |
| New Users | People visiting your site for the first time | Tells you if you’re attracting new visitors |
| Sessions | Each visit to your site | Shows how often people come to your site |
| Session Duration | How long people stay on your site | Longer visits usually mean people like your content |
| Engagement Rate | The percentage of sessions that were engaged (lasted longer than 10 seconds or had a key event) | Shows how actively users are interacting with your content. |
By keeping an eye on these metrics, you can track your site’s growth, see how engaging your content is, and spot areas that might need improvement.
Acquisition Metrics
Acquisition metrics reveal which of your marketing efforts are paying off and where you might want to focus more attention.
Let’s break down the main ways people arrive at your site:
| Metric | What it Means | Why it Matters |
|---|---|---|
| Organic Traffic | People who find your site through search engines | Shows how well your site ranks in search results |
| Paid Traffic | Visitors who come from paid ads | Tells you if your ad campaigns are working |
| Referral Traffic | People who click links to your site from other websites | Helps you see which other sites are sending you visitors |
| Direct Traffic | People who type your URL directly or use bookmarks | Indicates brand awareness and loyalty |
| Social Traffic | Visitors from social media platforms | Shows how well your social media efforts are working |
These metrics paint a picture of your most effective traffic sources, helping you fine-tune your marketing strategy.
Behavior Metrics
Once visitors land on your site, what do they do? Behavior metrics shed light on how people interact with your content and navigate your pages.
Here are the key indicators to keep an eye on:
| Metric | What it Shows | Why it’s Valuable |
|---|---|---|
| Views | Total number of pages viewed | Highlights your most popular content |
| Views per session | Number of pages visited in one session | Indicates how engaging your site is overall |
| Average Engagement Time | How long the website was in focus on the user’s screen | Suggests which content resonates most |
| Unique Pageviews | Individual page visits | Differentiates between new and repeat views |
| Exit Rate | Where people tend to leave your site | Points out potential weak spots in your content |
By understanding these metrics, you can identify your top-performing content and spot areas that might need a boost.
Conversion Metrics
Conversion metrics are all about results. They show you when visitors take the actions you want them to, like making a purchase or signing up for a newsletter.
Here’s a look at the key conversion metrics:
| Metric | What it Measures | Why it’s Crucial |
|---|---|---|
| Key Events | How often visitors complete specific important actions (formerly called conversions) | Shows if your site is achieving its objectives |
| Conversion Rate | Percentage of visitors who complete a key event | Indicates how effective your site is at driving desired actions |
| Revenue | Money earned from conversions | Directly ties your website performance to business results |
| Average Order Value | Typical amount spent per transaction | Helps you understand customer spending habits |
| Cost per Conversion | How much you spend to get each conversion | Allows you to assess the efficiency of your marketing efforts |
Understanding these metrics helps you see how well your site turns visitors into customers or leads. By improving your conversion metrics, you can boost your website’s impact on your bottom line.
How to Use Metrics in Google Analytics
Now that you know what metrics to look for, let’s see how to find and use them in Google Analytics.
Start by logging in to your Google Analytics account.

Once you’re in, look on the left side of the screen. You’ll see a sidebar with different options. Click on “Reports”.
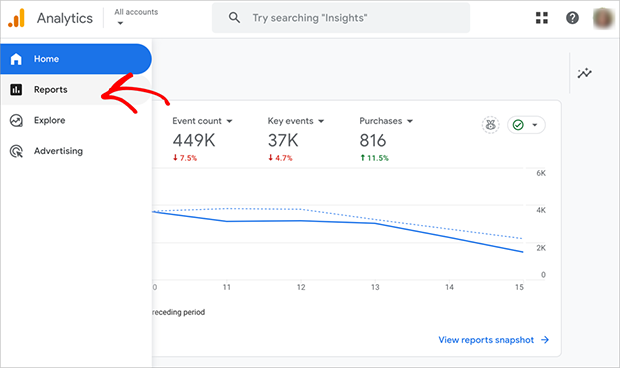
Next, you’ll see several report categories. These include things like “Acquisition”, “Engagement”, and “Monetization”.
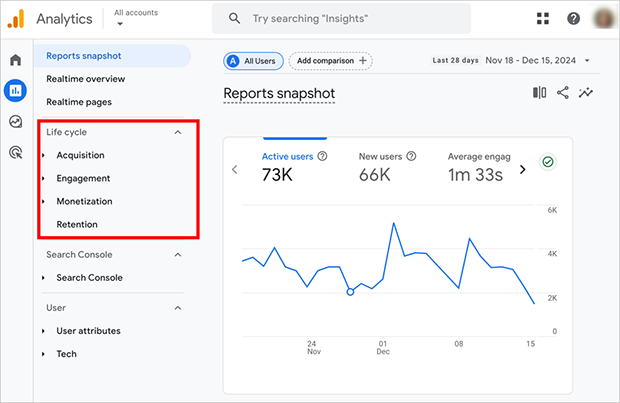
To see more detailed information, click on any of these categories. Inside each report, you’ll find various metrics. These are usually shown as charts and tables.
Let’s say you want to find out where your website visitors are coming from. To do this, look at the left sidebar and click on “Acquisition”.
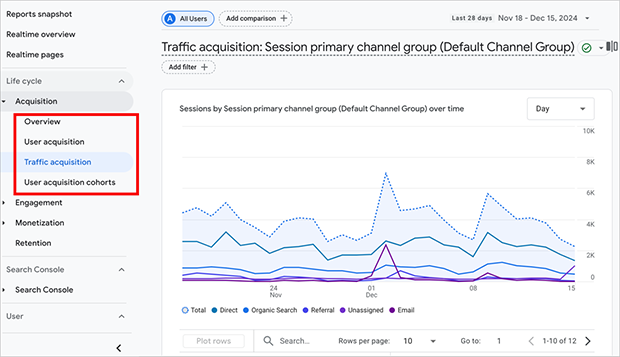
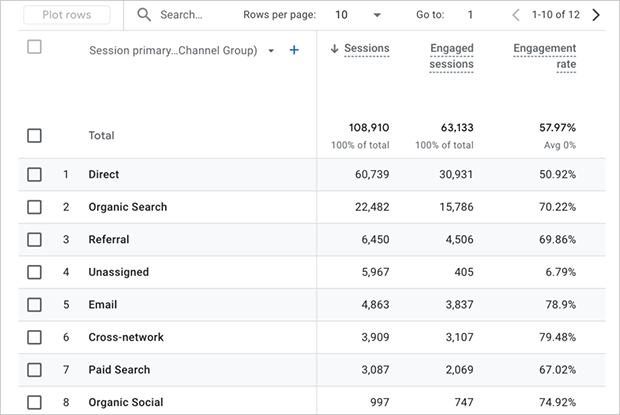
In the dropdown menu, select “Traffic acquisition”. Now, in the main part of the screen, you’ll see a breakdown of your traffic sources.
If you ever need to find something quickly, remember there’s a search bar at the top of the page. You can use this to find specific metrics or reports.
Setting Up Custom Reports in GA4
Sometimes, the standard reports in Google Analytics don’t show exactly what you need. That’s where custom reports are helpful. They let you pick the metrics you want to see together.
To create a custom report in Google Analytics, click on “Explore” in the left sidebar. It usually looks like a small graph with a magnifying glass or appears in the main navigation menu.
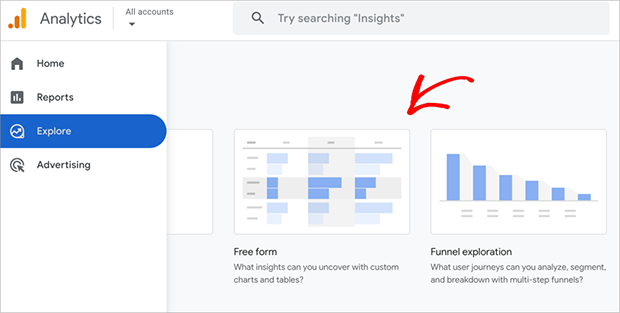
On the Explore page, choose “Free form”. This gives you some initial data to start with, making it easier to build your report.
Next, select the date range for your report. It’s set to the last 30 days by default, but you can change this to any time you want.
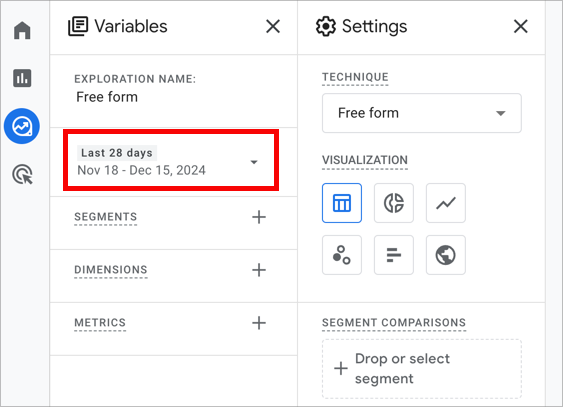
Now, start adding different parts to your report:
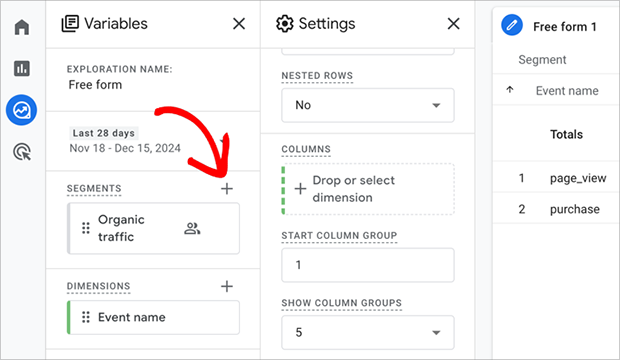
- Segments: These group your traffic into categories. For example, mobile users or users who made a purchase.
- Dimensions: These are the categories you want to analyze, like “Event name” or “Page location”.
- Metrics: These are the numbers you want to see, such as “Users”, “Pageviews”, or “Revenue”.
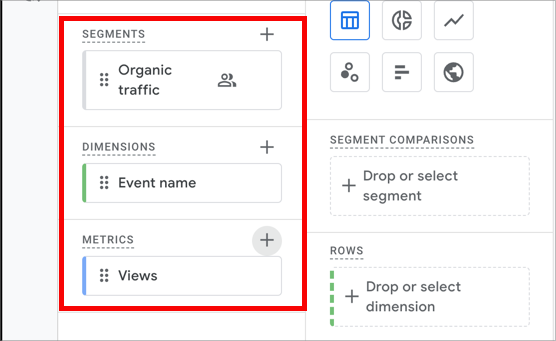
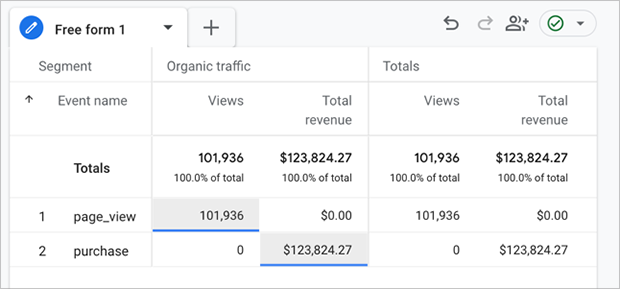
With the data sources in place, you can build your report using drag and drop:
- Drag segments to the “Segment Comparisons” box to compare different groups.
- Add dimensions to the rows or columns. If you’re new to this, start with rows.
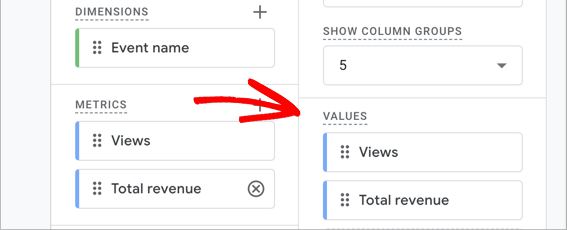
- Drag metrics to the “Values” section. This is where your numbers will appear.
Remember, creating custom reports takes practice. Don’t be afraid to try different combinations to find what works best for you.
Pro Tip: When creating custom reports, focus on metrics that directly relate to your business goals. Don’t worry if this seems overwhelming – later, I’ll show you how to get easy Google Analytics reports that make understanding your data much easier.
Creating User Segments in GA4
Segments help you look at specific groups of users or sessions. This lets you dig deeper into your data and understand different parts of your audience.
You can create segments based on many factors:
- Demographics: Age, gender, or location.
- Behavior: Pages visited, time spent on site, or purchases made.
- Technology: Device type, browser, or operating system.
- Traffic source: Where users came from (like Google search or social media).
Here’s how to create a user segment in GA4:
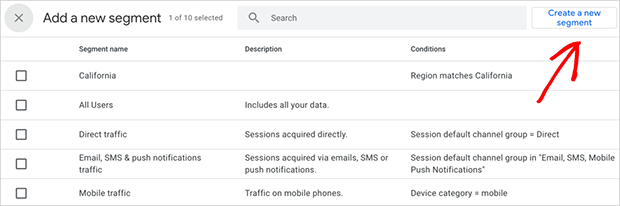
To create a segment, first, look at the top of your report and click on the “Add segment” button. This will open up a new window with segment options.
From here, choose “Create a segment” to start building your own custom segment.
Next, give your segment a name that describes the group you’re focusing on. Then, pick the conditions for your segment.
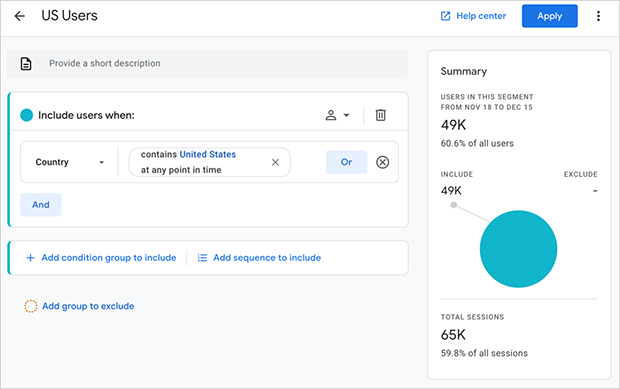
For example, you might select users from a specific country or those who visited a certain page on your site. You can add multiple conditions to narrow down your segment further.
Once you’re happy with your segment setup, click “Apply” to finish. Your new segment is now ready to use in your reports.
Analyzing Segment Data
Once you’ve created segments, you can use them to compare different groups. This helps you understand your audience better. Here are some ways to use segments:
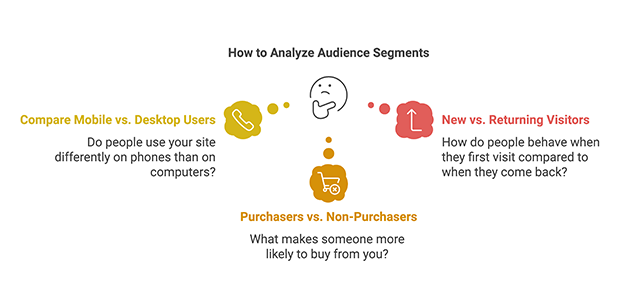
- Compare mobile vs. desktop users: This can show if people use your site differently on phones than on computers. For example, you might find that mobile users spend less time on your site or visit fewer pages.
- Look at new vs. returning visitors: This helps you see how people behave when they first visit your site compared to when they come back. You might find that returning visitors buy more or spend more time on your site.
- Check purchasers vs. non-purchasers: This can help you understand what makes someone more likely to buy from you. You might find that purchasers tend to visit certain pages more or come from specific traffic sources.
To analyze your segment data, apply your segments to any report you’re looking at. You can do this by clicking on the segment at the top of the report.
Next, look at how the metrics are different between your segments. For example, do mobile users have a higher bounce rate than desktop users?
Finally, think about why these differences exist and what they mean for your business. If mobile users aren’t staying on your site as long, maybe your mobile site needs to be easier to use.
A Clearer View of Your Website Metrics
If you’re feeling overwhelmed by the data in GA4, you’re not alone. Even I struggled at first, which is why we developed OnePageGA. We needed a way to simplify GA4 data and present it in a way that made sense.
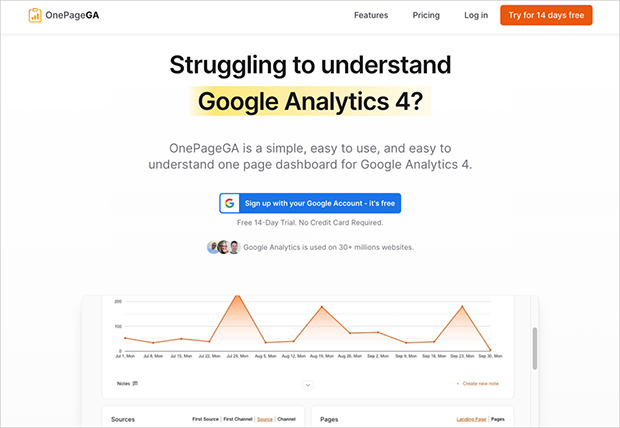
OnePageGA is a simple, yet powerful tool that shows your GA4 information on a single, easy-to-read page. No more clicking through multiple reports – you see all key metrics at a glance, saving time and making it easier to spot important trends.
We’ve cut through the clutter to show only the most critical data points. Whether you’re a beginner or not, you’ll find the dashboard easy to navigate and customizable to fit your needs.
For example, you might quickly notice that your website traffic increased alongside more frequent social media posts, leading you to focus more on your social media strategy.
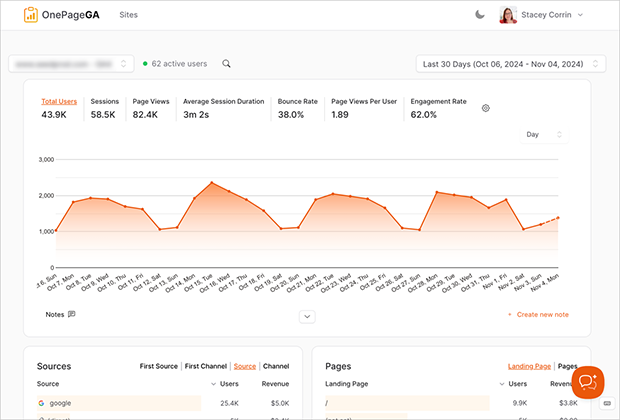
As you can see, OnePageGA presents your data in a clean, easy-to-understand format with simple Google Analytics reports. At a glance, you can see metrics like visitor numbers, top pages, and traffic sources without switching between screens or reports.
If you’ve been struggling with Google Analytics 4, OnePageGA could be just what you need. It gives you insights without complexity, helping you make data-driven decisions efficiently and take action with confidence.
Frequently Asked Questions
What’s the difference between a metric and a dimension in Google Analytics?
A metric is a number that measures something on your site, like sessions or revenue. A dimension gives context to that number, like the traffic source or country.
Can I create custom metrics in GA4?
Yes. You can create custom metrics by setting up custom events and marking the values you want to track. This helps you measure actions that GA4 doesn’t track by default.
How many metrics should I track?
It’s best to track only the metrics that support your business goals. Most sites focus on a small group that shows traffic, engagement, and conversions.
Do I need segments to analyze my metrics?
Segments aren’t required, but they help you understand how different groups behave. This makes your analysis more useful and easier to act on.
Turn Your Data Into Results
The metrics in Google Analytics offer a powerful way to understand your website by showing you what is and isn’t working. But numbers alone aren’t enough. The real value comes from using them to improve your visitors’ experience and achieve your business goals.
If you’re finding Google Analytics overwhelming, OnePageGA can help. It simplifies your data, allowing you to focus on what matters most – growing your online presence and connecting with your audience.
Start your free 14-day trial of OnePageGA today.
You may also find the following GA4 tutorials helpful:
- 4 Types of Events in Google Analytics
- How to Track File Downloads in Google Analytics 4
- How to Track Form Submissions in Google Analytics 4
- How to Increase Organic Search Traffic to Your Website
If you have questions or want to join the conversation, you can also find us on X.
