Measuring time on page in Google Analytics means tracking how long visitors stay engaged with your content. In GA4, this is now called Average Engagement Time, which measures the moments when users are actively viewing your site.
Since GA4 replaced Universal Analytics, many users have struggled to find this data. It’s still there, just under a new name and buried in different reports.
In this guide, I’ll show you how to find it, understand what it means, and see an easier way to track the same insights with OnePageGA.
What “Time on Page” Means in Google Analytics 4
In GA4, “Time on Page” has been replaced with Average Engagement Time, which measures how long users actively view or interact with your site. It only counts when your page is visible on screen, not when it’s open in a background tab.
This shift gives you a more accurate picture of real engagement instead of just page duration. Here’s how the new metrics compare to the old Universal Analytics terms:
| Metric | What It Measures | Where to Find | Replaces (UA Equivalent) |
|---|---|---|---|
| Average engagement time | Active on-screen time | Engagement → Pages and Screens | Time on page |
| Engagement rate | Percentage of engaged sessions | Engagement overview | Bounce rate |
Understanding these differences helps you read GA4 data correctly. Instead of guessing how long people stayed, you can now see when they were truly engaged.
How to Measure Time on Page in GA4
To measure time on page in GA4, open your property and go to Reports » Engagement » Pages and Screens.
In this report, look for the column labeled Average engagement time. This shows how long visitors are actively engaging with each page while it’s visible on screen.
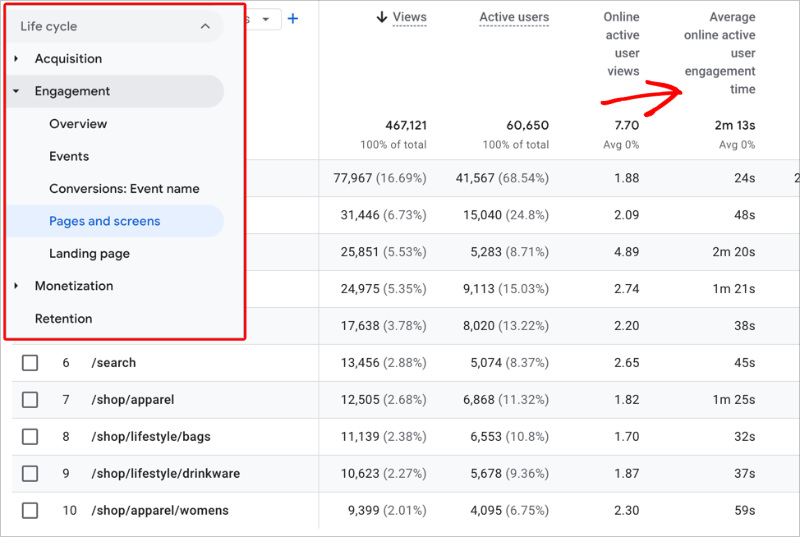
By default, the table displays Page path and screen class, which lists your page URLs. If you’d rather view page titles, click the dropdown above the table and choose Page title and screen class.

You can also click the “+” icon beside the dimension name to add a secondary dimension. A useful example is Device category, which lets you compare engagement time across mobile, tablet, and desktop users. This helps you see if visitors on one device type spend less time on your pages than others, which could indicate layout or speed issues.
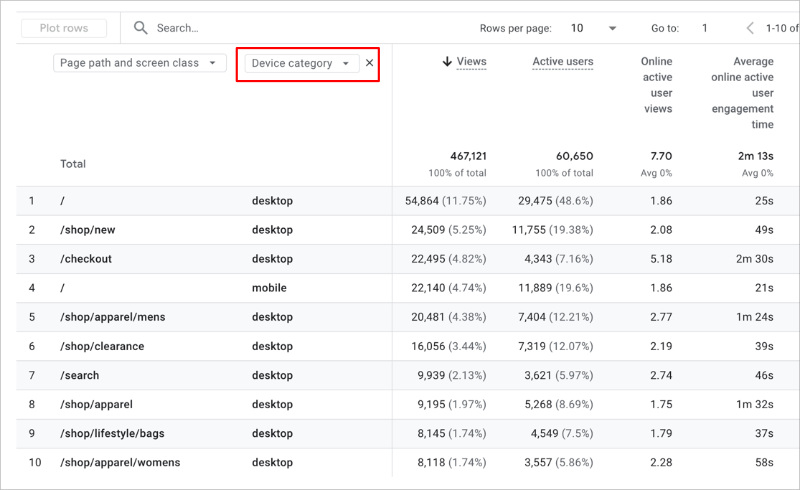
This setup gives you a complete view of how users engage with your content and which pages or devices drive the most attention.
How to Measure Time on Page in OnePageGA
If GA4 feels overwhelming, OnePageGA makes measuring time on page simple. It connects directly to your GA4 property and displays your key engagement metrics, including session duration and engagement rate, all in one clear dashboard.
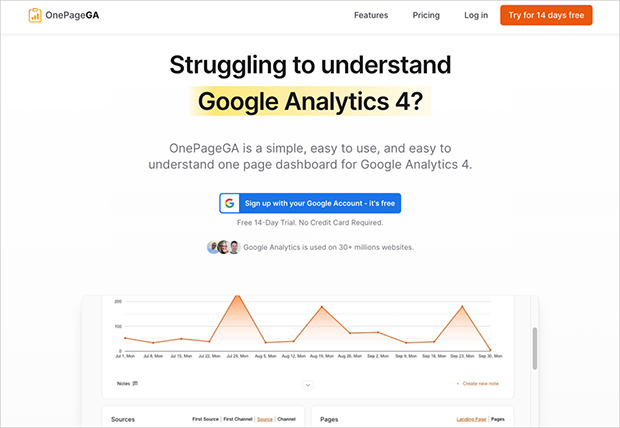
OnePageGA is designed for marketers, founders, and small teams who want fast, visual insights without digging through complex GA4 reports. Setup takes less than two minutes, and once connected, you can choose up to seven metrics to track, such as Average Session Duration, Page Views per User, and Engagement Rate.
Unlike GA4, OnePageGA also includes familiar metrics from Universal Analytics, such as Bounce Rate and Average Session Duration. These make it easier to interpret GA4’s engagement data using terms you already recognize.
Here are some of the metrics you can view in OnePageGA:
| Metric | What It Means |
|---|---|
| Page Views per User | Average number of pages each visitor views during their session |
| Sessions | Total number of visits to your website |
| Page Views | Total times pages are viewed across all sessions |
| Average Session Duration | Average amount of time users stay active during a session |
| Bounce Rate | Percentage of sessions with no engagement beyond the first page |
| Purchase Revenue | Total revenue generated from transactions |
| Ecommerce Purchases | Number of completed purchases on your site |
| Engaged Sessions | Sessions lasting at least 10 seconds or involving interaction |
| Engagement Rate | Percentage of sessions that qualify as engaged |
To display these metrics in your OnePageGA report, go to your connected dashboard and click Edit Metrics.
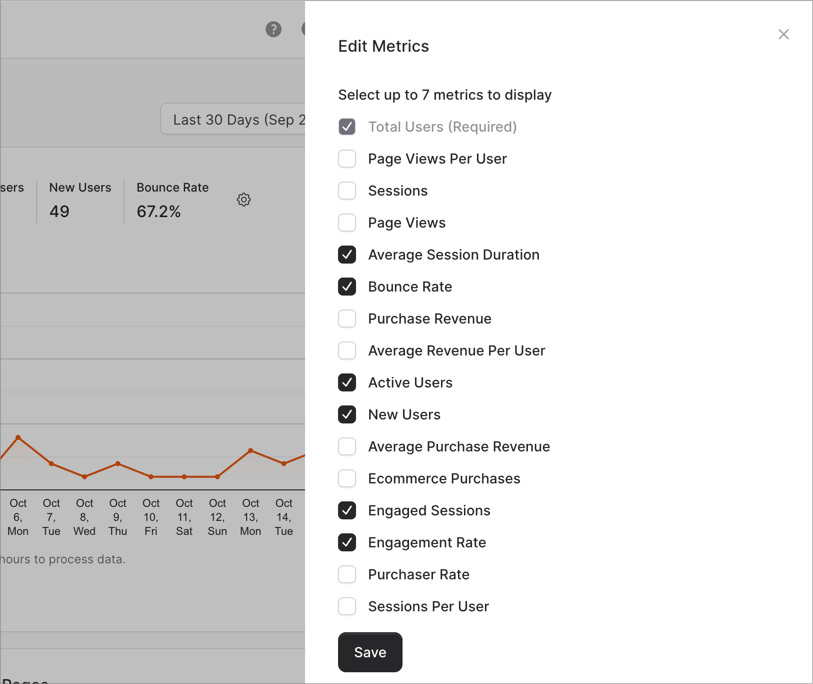
Choose up to seven from the list, then click Save to update your view. You can then click each metric to instantly see the data in a simple, one-page layout.
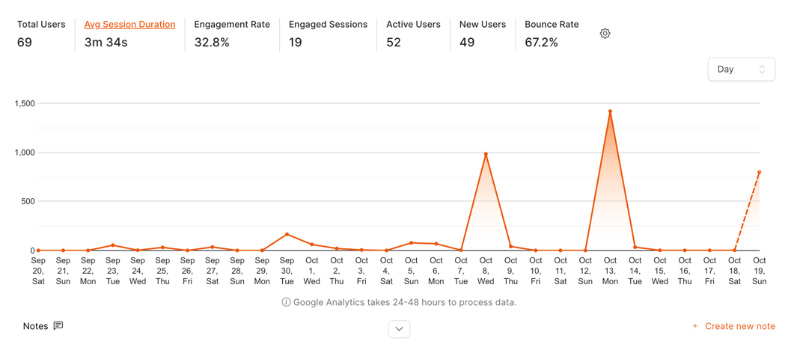
With OnePageGA, you can skip the complex tables and custom explorations. You get a clear snapshot of how long visitors stay, how engaged they are, and which pages perform best, all on one simple page.
How to Interpret Time-on-Page Metrics in GA4
Understanding your engagement time helps you see how well your content holds attention. GA4’s Average Engagement Time shows how long users actively view or interact with a page, giving you insight into what keeps them interested.
What counts as a “good” engagement time depends on the type of page. For example, a Contact page might only need a few seconds of engagement if users quickly find your phone number or form, while a blog post should naturally keep visitors for a minute or more.
Use this table to interpret your data and decide what to do next:
| Scenario | Engagement Time | What It Suggests | Optimization Action |
|---|---|---|---|
| Under 15 seconds | Very low | Visitors leave quickly without interacting | Improve load speed, simplify layout, or refine intro content |
| 30–60 seconds | Average | Typical engagement for blog or product pages | Add visuals, CTAs, or internal links to encourage longer visits |
| 90 seconds or more | Excellent | Visitors are highly engaged | Repurpose or promote similar content for more traffic |
Tracking these trends over time helps you spot what works and what needs improvement. If you want to see these engagement insights faster, OnePageGA brings them together in a single, visual report.
FAQs About Measuring Time on Page in GA4
Why can’t I find “Average Time on Page” in GA4?
GA4 no longer uses “Average Time on Page.” It’s been replaced by Average Engagement Time, which only measures the time users actively spend viewing or interacting with your content.
How is engagement time calculated in GA4?
GA4 tracks engagement time whenever your webpage is in an active browser tab. If someone switches tabs or minimizes the window, the timer pauses, giving you a more accurate measure of real attention.
Does GA4 still track bounce rate?
Yes, but it’s calculated differently. GA4’s Bounce Rate now measures the percentage of sessions that were not engaged, meaning users didn’t stay at least 10 seconds or trigger an event.
What’s the difference between Engagement Time and Session Duration?
Engagement Time measures how long users were active on screen, while Session Duration includes total time from when a session starts until it ends. Engagement Time is more reliable for judging true attention.
See Your Engagement Time Clearly
GA4 makes it possible to track how long visitors stay active on your pages, but finding and interpreting that data can take time. Tools like OnePageGA simplify the process by showing your engagement metrics in a single, easy-to-read view.
You may also find the following GA4 guides helpful:
- What Is a Conversion in Google Analytics
- How to Increase Organic Search Traffic to Your Website
- How to Add Annotations in Google Analytics 4
- How to Find Your Top Converting Traffic Sources in GA4
If you have questions or want to join the conversation, you can also find us on X and Facebook.

