Last year, I spent weeks writing a blog post I thought would be a hit. I checked my analytics the next day and saw a huge spike in pageviews — over 3,000 people in one weekend. I was thrilled.
But here’s the thing. Almost all of them bounced.
They didn’t click anything. No one signed up. No one shared it. For a while, I kept chasing pageviews, thinking that was the sign of success. It took me a while to realize I was tracking the wrong thing.
If you’ve ever opened Google Analytics 4 and felt completely lost, you’re not alone. It’s packed with data, but figuring out which numbers actually matter can feel overwhelming.
That’s what this guide is for.
I’ll show you the content marketing metrics that actually matter, how to track them in both GA4 and OnePageGA, and most importantly, how to use them to make better decisions about your content.
What Are Content Marketing Metrics?
Content marketing metrics are the numbers that show how your content is performing.
Content marketing isn’t a side tactic anymore. It’s a core part of most strategies — 73% of B2B marketers and 70% of B2C marketers use it to reach their audience.
These metrics tell you how people are finding your site, what they do after landing on a page, and whether your content is helping you reach goals like signups or sales.
Some common examples include:
- Traffic — how many people visit your content
- Engagement — how long they stay and what they interact with
- Conversions — actions like purchases, form fills, or email signups
- Behavior — things like scroll depth or which pages they visit next
I use these to answer simple but important questions. Is this post attracting the right audience? Are people actually reading it? Is it doing anything useful for the business?
Before I write something new or spend time promoting a piece, I always check these numbers. If something’s working, I want to know why. If it’s not, I want to fix it.
Here’s the part that took me a while to figure out. Some of these metrics matter more than others. A few will give you real answers. The rest just fill up space on a dashboard.
So instead of tracking everything, I focus on the ones that help me make better decisions.
Next, I’ll show you which metrics those are and how I use them.
The Content Marketing Metrics That Actually Matter
You don’t need to track everything. In fact, trying to monitor too many numbers can slow you down and make things more confusing than helpful.
What you really need is a small set of metrics that tell you what’s working, what’s not, and where to focus next. That’s what I rely on in my own content strategy.
Let’s start with the first one I always look at.
Traffic by Source
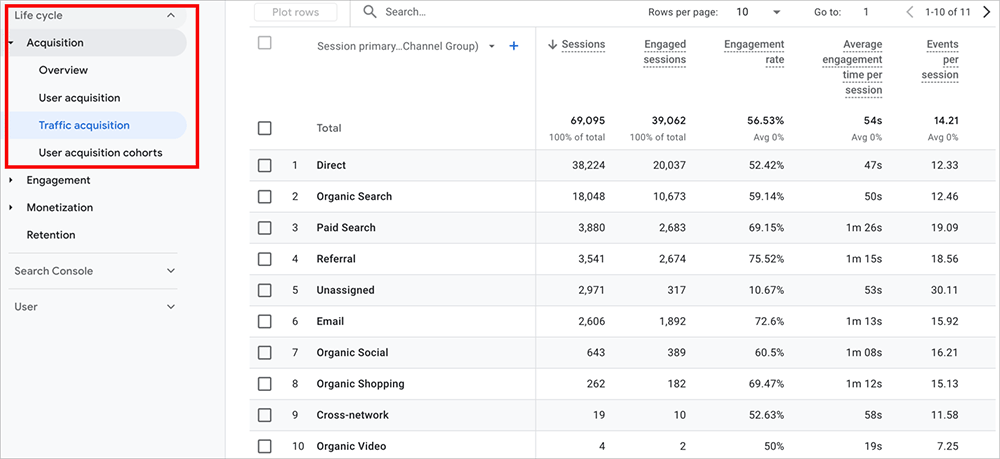
One of the first things I check is where my traffic is coming from. If most of my visitors are finding me through search, I know my SEO is working. If social or email is bringing in more clicks, that tells me where to focus next.
It also helps me spot gaps. I’ve seen campaigns where most of the effort went into social media — which makes sense, since 73% of content marketers use it. But when the traffic reports showed that search was performing way better, I knew I needed to shift my priorities.
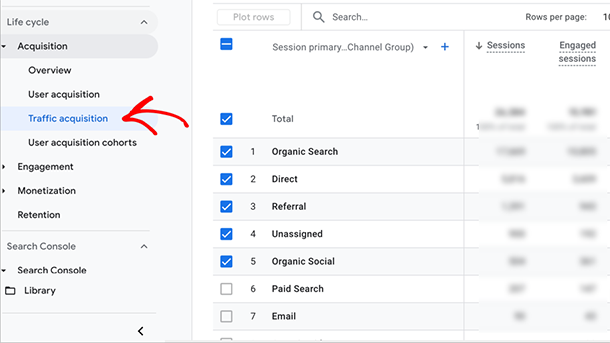
You can track traffic sources in GA4 by going to Reports » Acquisition » Traffic acquisition.
In OnePageGA, just open the Sources report and filter by Channel or Source/Medium.
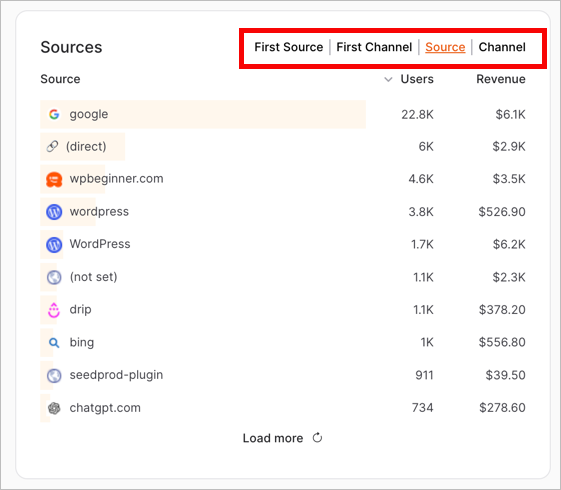
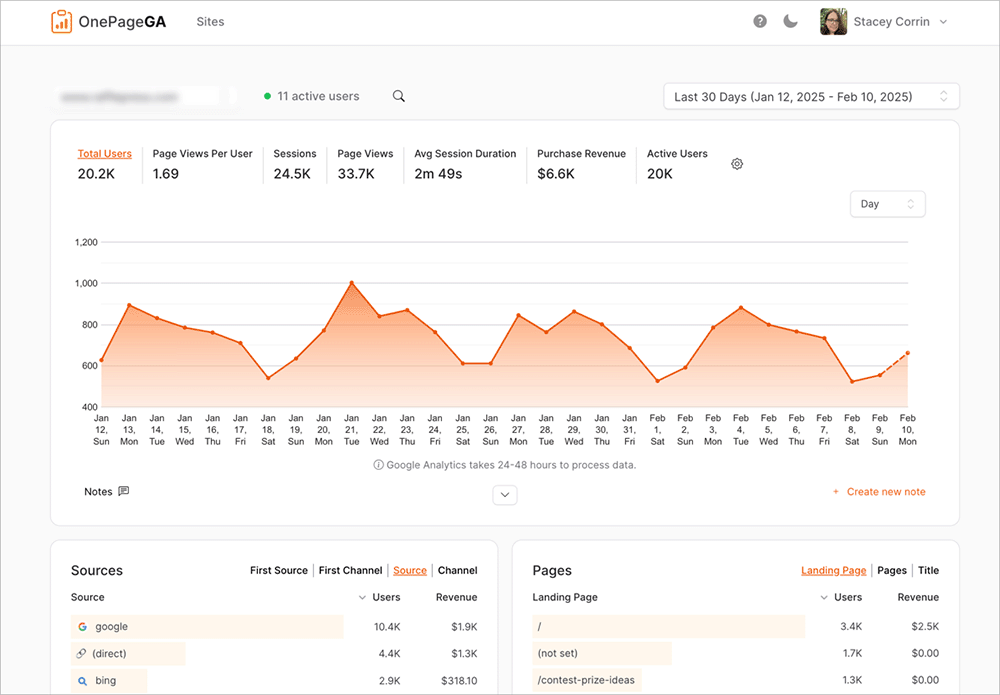
If you haven’t used OnePageGA yet, it’s a simple Google Analytics 4 dashboard that shows all your key metrics on one screen. It connects directly to your GA4 account but removes all the noise, so you can get answers fast without clicking through endless menus.
If you’re running any kind of campaign, I always recommend using UTMs. That way, you can see exactly which links are driving results without having to guess later.
Engagement Rate
GA4 doesn’t show bounce rate by default anymore, and honestly, I don’t miss it. These days, I use engagement rate instead. It tells me how many people are actually interacting with my content instead of just clicking and leaving.
In GA4, a session is counted as engaged if the visitor stays for more than 10 seconds, views at least two pages, or triggers a conversion event. So when I see a high engagement rate, I know people are sticking around and doing something useful.
This matters because attention is hard to earn. One study found that personalized content creates a 20% increase in sales opportunities, but only if people actually engage with what you’re publishing.
To check engagement rate in GA4, go to Reports » Engagement » Pages and screens, then click the pencil icon to customize the report.
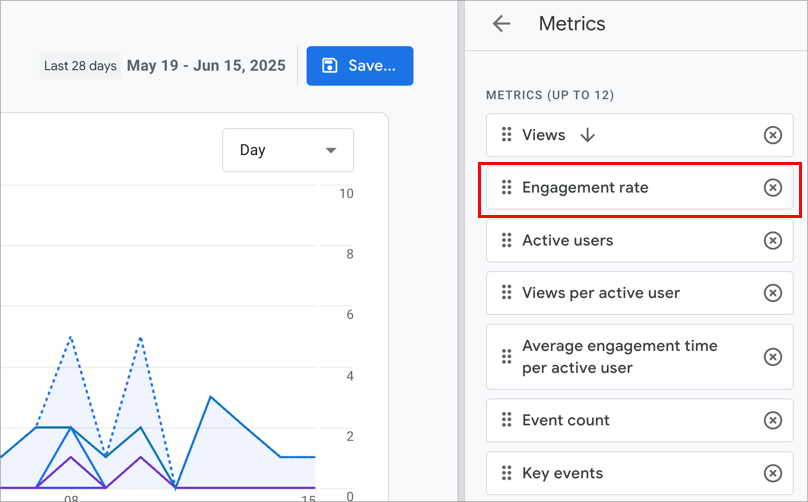
From there, you can add Engagement Rate as a visible metric.
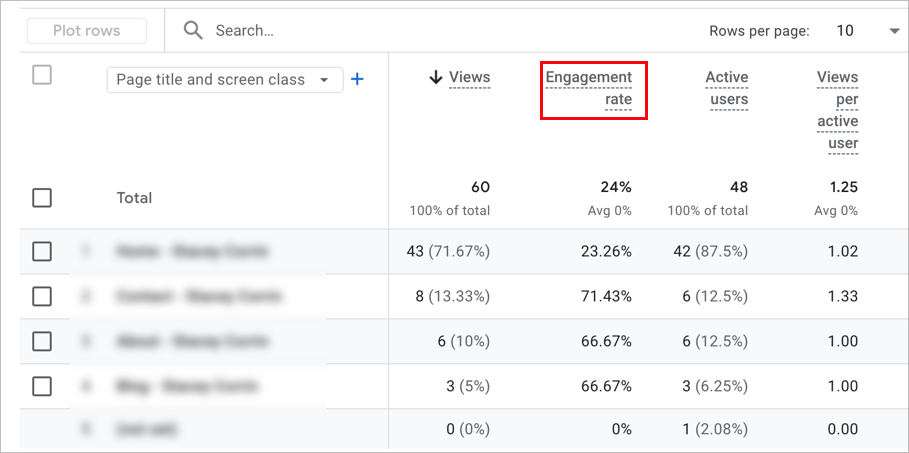
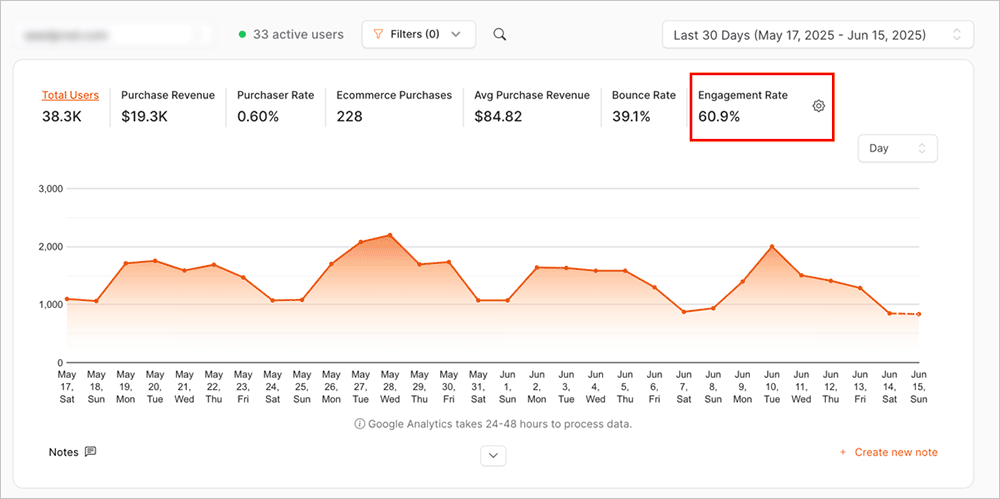
In OnePageGA, you can see it right on the main dashboard or drill into it in the Pages report.
I use this number all the time to spot weak intros or pages that need a clearer call to action.
Average Engagement Time
Average Engagement Time shows how long people are actively paying attention to your content. It’s not just how long the tab is open, it’s how long they’re actually scrolling, clicking, or interacting with the page.
I use this metric when I want to see if a piece is really holding interest. Low numbers usually mean something went wrong. Maybe the headline didn’t match the content, or the intro lost people before they got to the good stuff.
But when engagement time hits a minute or more, I know readers are sticking around. That usually means they’re reading, exploring, and getting value from what they’re seeing.
It lines up with what Nielsen Norman Group found. Most people leave a page within 10 to 20 seconds unless they find something useful.
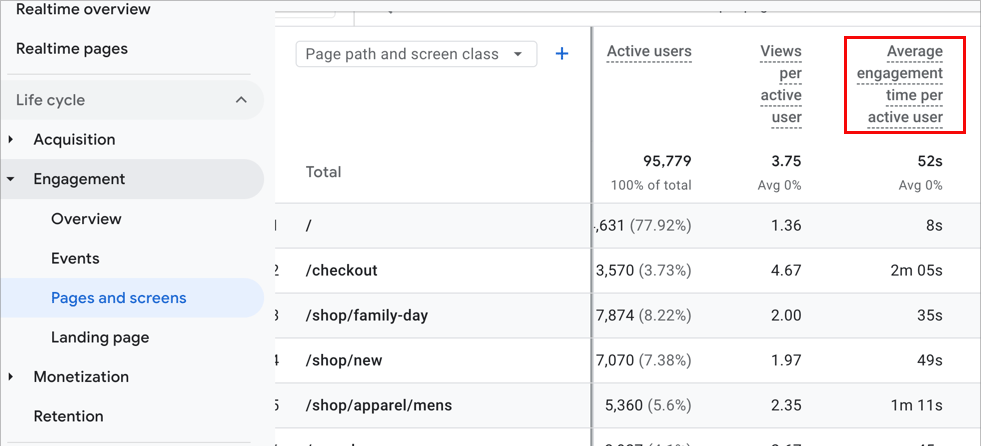
In GA4, you can find this under Reports » Engagement » Pages and screens.
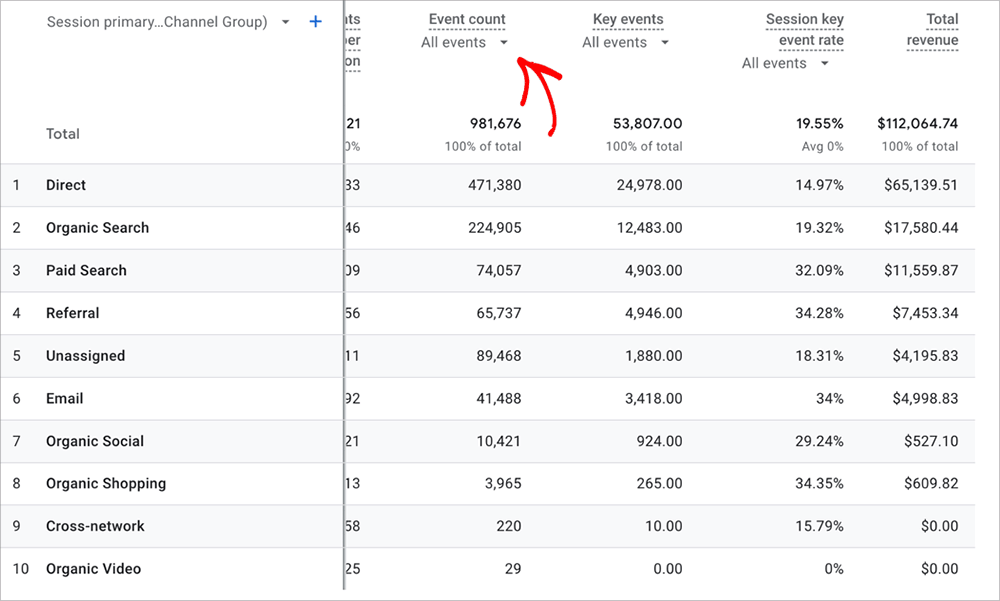
Key Conversions / Events
At the end of the day, this is the metric that matters most — are people taking action?
For me, that means tracking things like email signups, purchases, or contact form submissions. If a piece of content is getting views but not leading to any conversions, I know something’s missing. Maybe the CTA isn’t clear enough. Maybe the offer doesn’t match the reader’s intent.
GA4 lets you track these actions as either events or conversions. You can find them by going to Configure » Events, then mark the ones that matter most to you as conversions.
In OnePageGA, it’s much faster. Just open your Events report and filter by the conversion actions you care about — things like generate_lead, sign_up, or purchase.
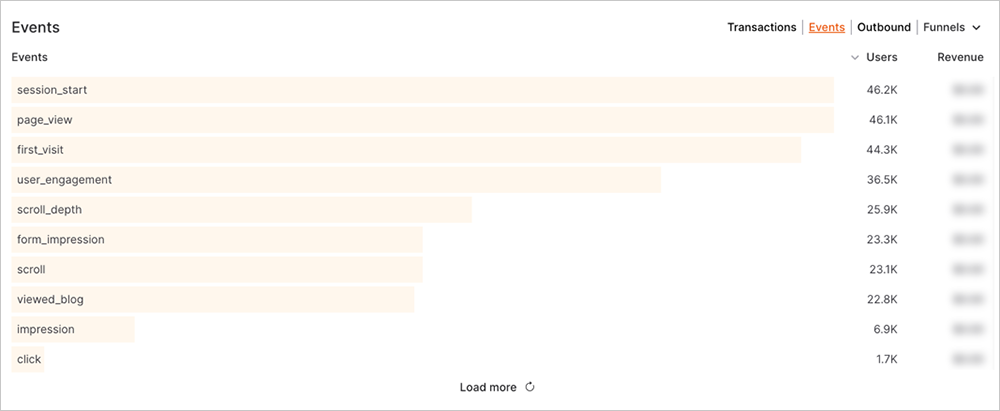
This is how I connect content to actual results. Views are nice, but conversions show whether it’s doing real work.
Vies per Session
This metric, formerly called “Pages per Session” in Universal Analytics, shows how many pages someone views during a single session. I use it to get a feel for how engaging and connected my content is. If people are reading one post and then checking out more, that tells me I’m on the right track.
But if most sessions stop after one page, it might mean my internal links aren’t strong enough or the next step isn’t clear. Sometimes it’s just a layout issue. Either way, this number helps me spot it.
In GA4, you’ll need to use Explore reports to view Views per Session, since it’s not available in standard reports.
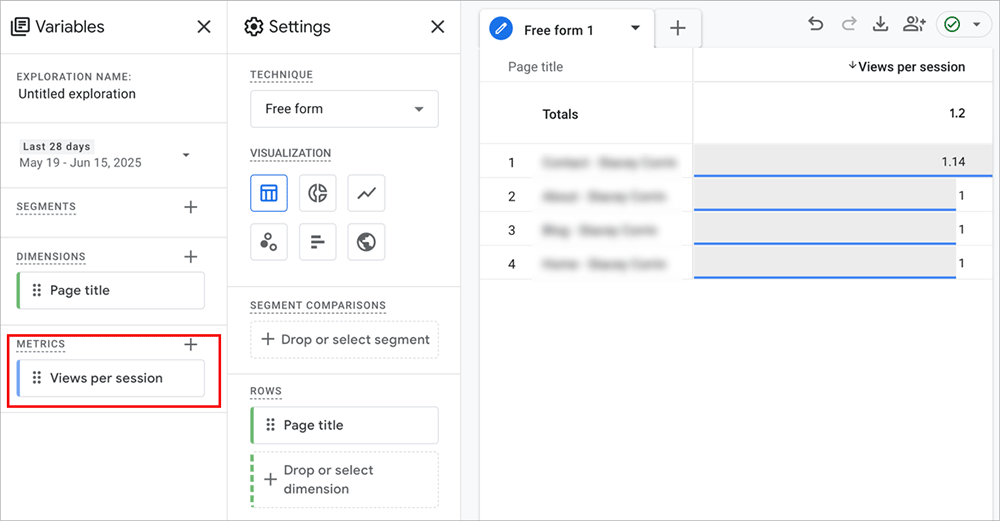
It’s a small metric, but it gives me useful clues about whether my site structure and content flow are doing their job.
Backlinks and Referral Traffic
Backlinks and referral traffic help you see which other websites are sending visitors your way. I check this to find out which partnerships, mentions, or guest posts are actually driving results.
It’s also a helpful way to spot content that’s building authority. When credible sites link to you, it often means the content is useful, and that can give your SEO a boost too.
In GA4, head to the Acquisition report and filter by Referral to view this traffic.
If you want to see exactly who’s linking to you, tools like Google Search Console, Ahrefs, or Semrush will give you the backlink data GA4 doesn’t show.
This is one of the ways I decide which posts are worth updating, promoting, or repurposing. If someone’s already linked to it, that’s a signal it’s worth keeping fresh.
Top Landing Pages
Your landing pages are the first thing people see when they visit your site. I always keep an eye on which ones bring in the most new users. These are the pages doing the most work, whether the traffic is coming from search, social, or other sites.
When a landing page is performing well, I ask a few simple questions. Is there a clear call to action? Does the content feel current? Can I add internal links to help people keep exploring?
In GA4, you can find this information by going to Engagement » Landing page.
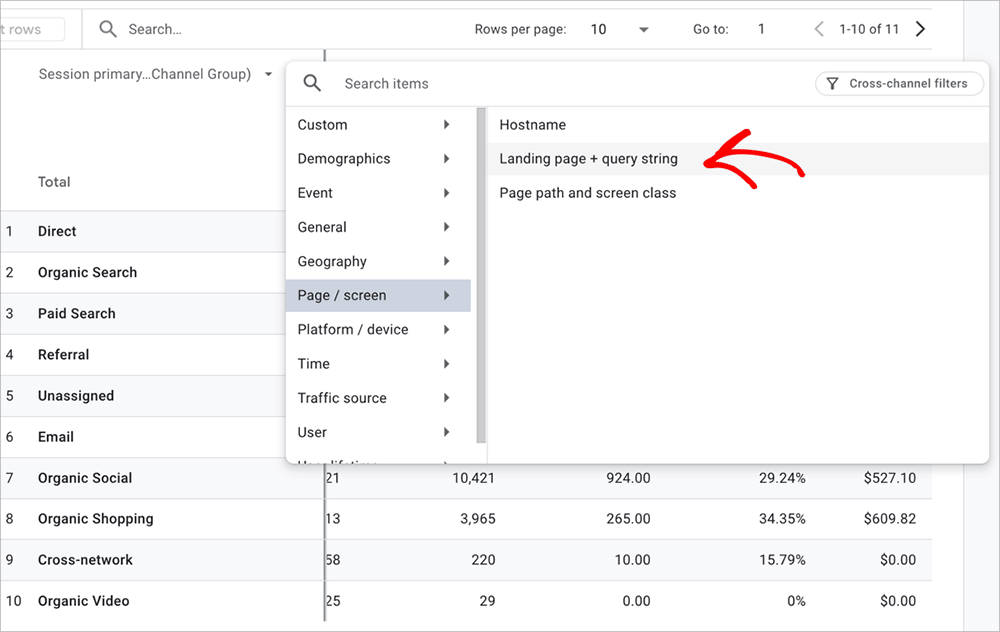
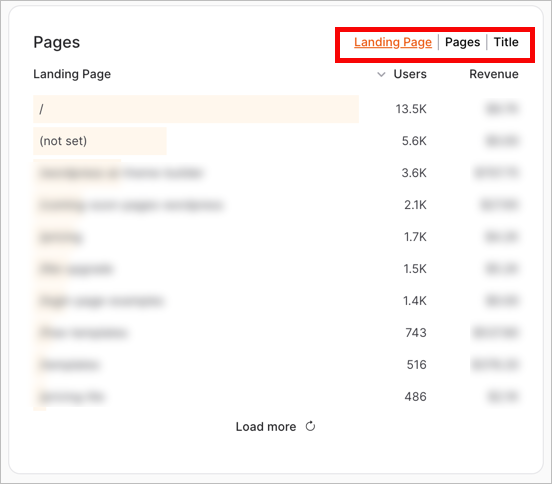
In OnePageGA, open the Pages report and sort by Users to see which content is attracting first-time visitors.
If you want to improve conversions or get more value from your traffic, this is one of the best places to start.
How to Use These Metrics to Improve Your Content
By now, you’ve seen how each of these metrics can help you spot what’s working and what needs improvement. Here’s how I pull it all together when I’m reviewing content:
- Low engagement rate? Rewrite the intro or break up the layout.
- High time on page but no conversions? Add or improve your call to action.
- Top landing page? Update it, link to it more, or turn it into a lead magnet.
- Low scroll depth? If you’ve enabled scroll tracking, check where people drop off. I’ve used that to spot weak sections in tutorials and blog posts that lose readers halfway through.
I usually check these once a week for new content, then review everything else about once a month. It doesn’t take long, and it keeps my content moving in the right direction.
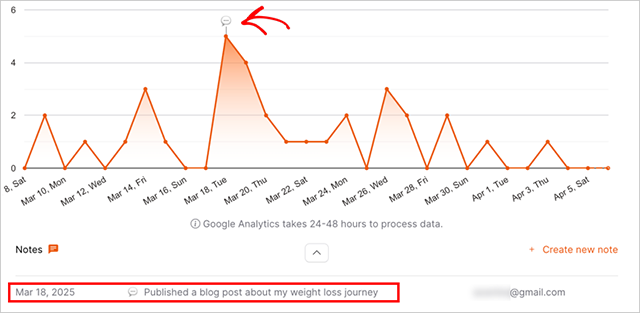
If you’re making changes, I also recommend adding annotations in GA4 or OnePageGA. It helps you see what changed and why performance shifted later on.
Want Content Marketing Metrics in One Place?
GA4 is powerful, but let’s be honest, finding your way around it can be a pain. Even simple questions take too many clicks, and important metrics are buried in different reports.
That’s why I started using OnePageGA.
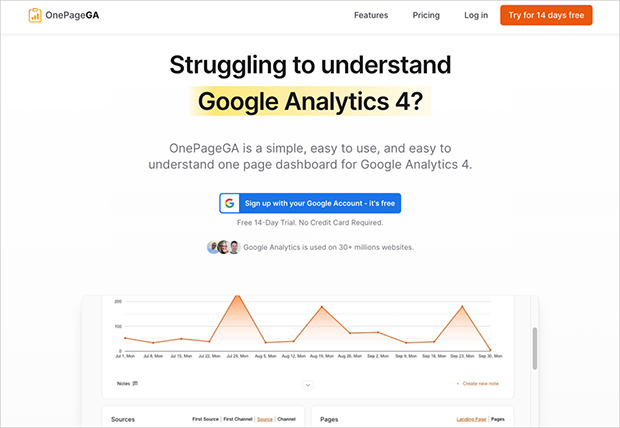
It’s a clear, one-page dashboard that connects to your Google Analytics account and shows all your key content metrics in one place. You can filter by source, page, campaign, or event without having to dig through endless menus.
If you want to spend less time clicking around and more time improving your content, it’s worth a look.
Start your free 14-day trial — no credit card needed.
FAQs About Content Marketing Metrics
What’s the difference between a metric and a KPI?
A metric is just a data point, like bounce rate or average time on page. A KPI (key performance indicator) is a metric that’s tied to a goal. For example, if your goal is to grow your email list, your KPI might be signups per blog post.
Should I track bounce rate in GA4?
No — GA4 doesn’t even show bounce rate by default. Use engagement rate instead. It gives a more accurate picture of whether visitors are actually interacting with your content.
Can I track content performance in real time?
Yes. Both GA4 and OnePageGA let you see real-time activity on your site. It’s helpful for monitoring traffic during launches or when you publish a new post.
Do these metrics apply to all types of content?
They do, but how you use them depends on the content. A blog post might focus more on engagement time and scroll depth. A landing page or product page might be more about conversions.
The Simple Metrics I Keep Coming Back To
Content marketing gets easier once you know what to measure. You don’t need fancy reports or dozens of charts — just a few key numbers that help you make better decisions.
Start with the basics, check them regularly, and use what you find to improve one thing at a time. That’s how I’ve grown my own sites, and it’s still the process I trust most.
If you want a simpler way to track what’s working, try OnePageGA. It shows all your key content metrics on one screen, no setup headaches or confusing menus.
Want to keep improving your content strategy and get more from your analytics? Here are a few helpful guides:
- What Is a Metric in Google Analytics?
A beginner-friendly breakdown of what counts as a metric — and why it matters. - How to Track Website Visitors
Simple steps to understand who’s visiting your site and where they’re coming from. - Best Web Analytics Tools
A curated list of analytics tools, including GA4 alternatives, to help you track what matters.
If you have questions or want to join the conversation, you can also find us on X and Facebook.
