I used to rely on bounce rate all the time in Universal Analytics. It was how I spotted underperforming pages quickly. Then GA4 came along and changed the rules.
Bounce rate got replaced by engagement rate, which tracks meaningful sessions, like someone spending time on your site or clicking around. At first, I wasn’t sure what counted or when I should still check bounce rate.
If you’ve wondered the same thing, this guide clears it up. I’ll explain how both metrics work in GA4, how they’ve changed, and when to use each one.
What Is Engagement Rate in Google Analytics 4?
Engagement rate tells you how many sessions actually mattered. Not just visits, but sessions where someone stuck around or interacted with your site.
In GA4, a session is a visit to your website that includes all the activity from one user during a short period of time. By default, GA4 ends a session after 30 minutes of inactivity, so if someone comes back later, it counts as a new one.
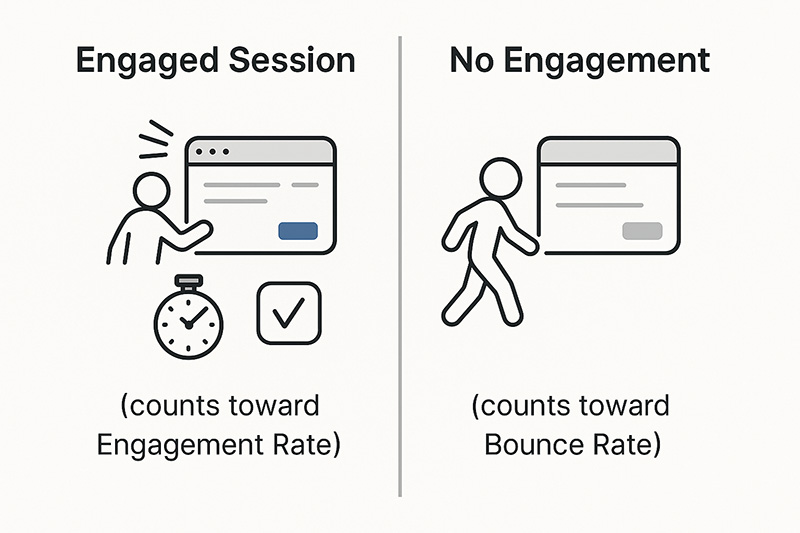
A session is counted as engaged if the user:
- Stayed on your site for 10 seconds or longer
- Viewed two or more pages or screens
- Triggered a conversion event (like a form submit or a purchase)
So if someone scrolls, clicks, or completes an action, GA4 sees that as real engagement. If they land and leave without doing anything, it doesn’t count.
You’ll find engagement rate under Reports » Engagement » Overview.
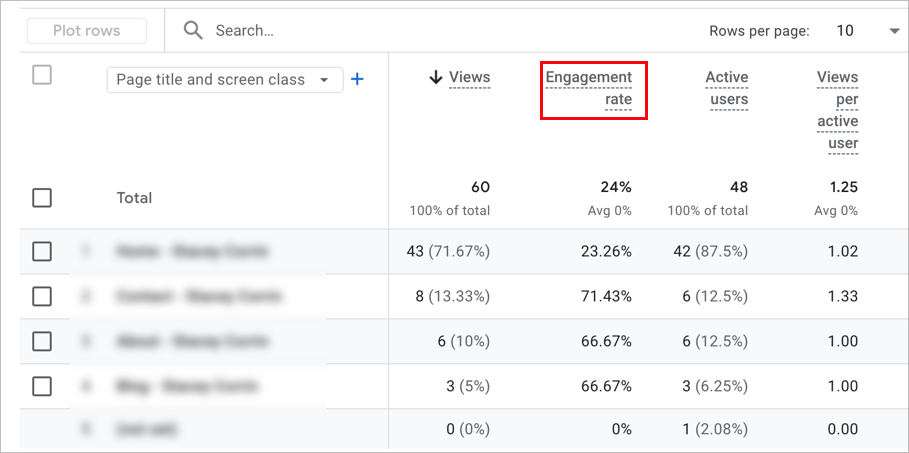
It shows up as a percentage, along with metrics like engaged sessions and average engagement time.
Key Takeaway: Engagement rate shows how many sessions involved real interaction, not just a visit.
What Is Bounce Rate in GA4? (And How It’s Different Now)
Bounce rate used to mean one thing: someone landed on your site and left without clicking or doing anything else. In Universal Analytics, that counted as a bounce.
In GA4, the definition changed.
Now, bounce rate is the percentage of sessions that had no engagement. That means the user didn’t stay for at least 10 seconds, didn’t view a second page, and didn’t trigger a conversion event.
Basically, bounce rate is the opposite of engagement rate. GA4 calculates it like this:
Bounce rate = 100% minus engagement rate
You won’t see bounce rate in GA4 reports by default. To add it:
Go to Reports » Engagement » Pages and Screens, click the pencil icon to edit the report, then add “Bounce rate” as a metric.
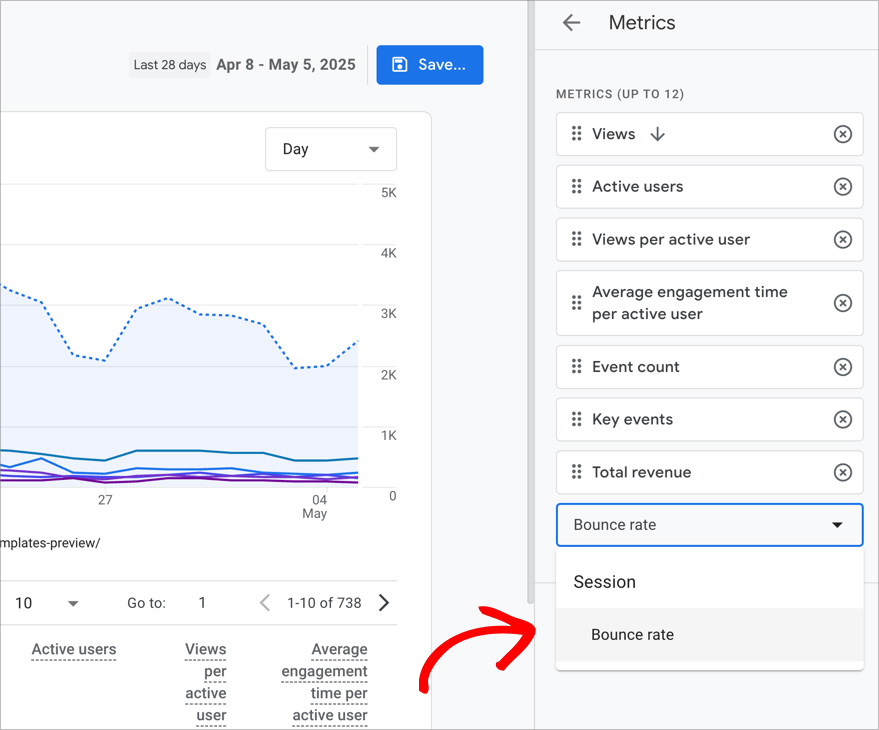
If you’re not sure where to find it, here’s a guide on how to find bounce rate in GA4.
Key Takeaway: In GA4, bounce rate shows sessions without engagement. It’s a reversal of engagement rate and is harder to interpret by itself.
Engagement Rate vs Bounce Rate: What’s the Real Difference?
Engagement rate and bounce rate are tied together in GA4, but they tell you very different things.
Engagement rate shows what users did.
Bounce rate shows what they didn’t do.
One focuses on positive behavior. The other flags a lack of activity.
Here’s a quick comparison:
| Metric | GA4 Definition | What It Shows |
| Engagement Rate | Sessions with 10s+, conversion, or 2+ screens | Active interest |
| Bounce Rate | Sessions with no engagement | Passive or disinterested traffic |
Both metrics come from the same set of data, but engagement rate gives you more to work with. You can track what’s working, what content holds attention, and where users actually interact.
When Should You Use Engagement Rate?
If you want to know what’s working on your site, engagement rate is the metric to watch.
I use it when I’m testing landing pages, updating blog content, or checking traffic from paid campaigns. It tells me if people are actually interacting instead of loading the page and leaving.
It’s especially helpful for:
- Landing pages
- Blog posts
- Paid ads with UTM links
- Email campaigns
- Mobile vs desktop comparisons
For most blogs and landing pages, I aim for 60 percent or higher. If I see a drop below 40 percent, I take a closer look to see what’s not working.
You can segment by traffic source, page, or device in GA4. I like pairing this with the top converting traffic sources in GA4 to figure out which ones bring visitors who actually stick around.
I also usually check OnePageGA instead because it shows engagement rate alongside everything else in one view.
When Should You Look at Bounce Rate?
Even though bounce rate isn’t as useful as it used to be, I still check it when something feels off.
A high bounce rate can point to:
- Broken or slow-loading pages
- Bad-fit traffic from ads or social posts
- Misleading meta titles or descriptions
- Content that doesn’t match search intent
But it’s not always a problem. Some pages are meant to be quick. That includes a contact page, a thank-you page, or a single-page guide. In those cases, a high bounce rate might be completely fine.
If bounce rate is high and engagement rate is low, that’s when I dig in and look closer.
How to Track Engagement Rate and Bounce Rate the Easy Way
If GA4 feels like too much clicking and not enough clarity, OnePageGA can help.
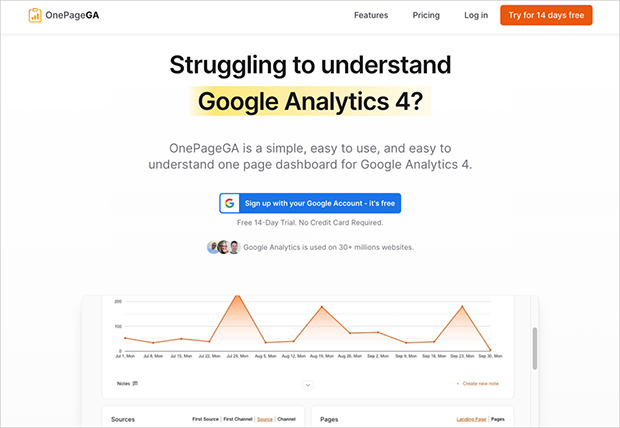
It’s a single-page GA4 dashboard that shows your most important metrics, including engagement rate and bounce rate, all in one place. You don’t need to build custom reports or dig through menus. Just connect your site, choose what you want to see, and get a clear view of your data.
Here’s how to view both metrics in OnePageGA:
- Click Edit Metrics
- Select Engagement Rate and Bounce Rate
- Apply filters by traffic source, page, or campaign
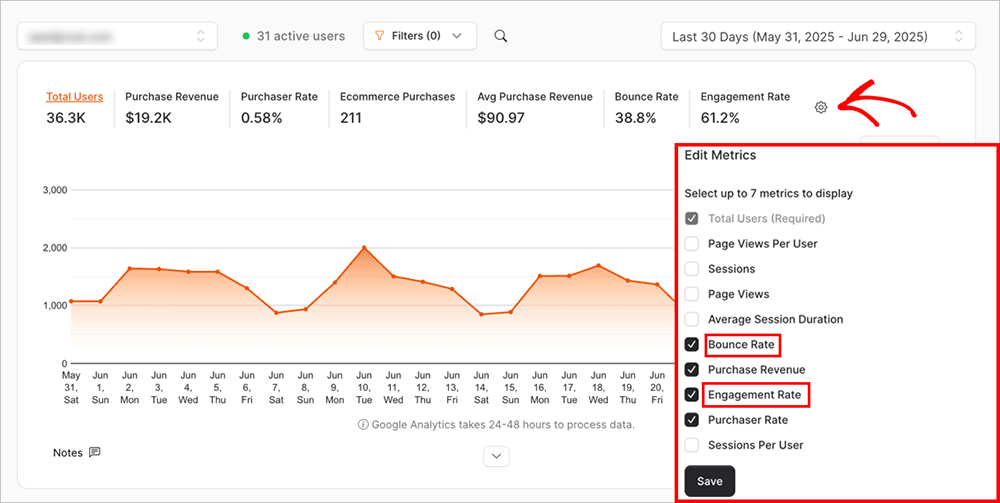
You can quickly spot what’s getting results and what needs attention, without clicking through multiple reports or trying to decode the data.
FAQs About Bounce Rate vs Engagement Rate
Q: Is a high engagement rate good in GA4?
A: Yes. A high engagement rate means people are interacting with your site. Over 50 percent is a solid benchmark for most pages.
Q: Why is my GA4 bounce rate showing as 0 percent?
A: That usually means GA4 is tracking every session as engaged. This can happen if events fire automatically when the page loads, even if the user doesn’t interact. You can check your setup and fix auto-triggered events here.
Q: Can I compare bounce rate from Universal Analytics to GA4?
A: Not directly. The definitions are different, so comparing them one-to-one won’t give you accurate insights.
Q: What’s a good engagement rate for a blog?
A: Around 60 to 70 percent is a healthy range, but it depends on your topic, audience, and content format.
Q: Where can I see both metrics together without customizing GA4?
A: OnePageGA shows both engagement rate and bounce rate on a single dashboard, with no setup required.
What I Focus On (and You Should Too)
I’ve moved away from bounce rate as a core metric. These days, I rely on engagement rate to understand what content is actually working — especially when I’m testing campaigns or updating older blog posts.
If you’re still stuck clicking through GA4 trying to compare the two, give OnePageGA a try. It shows both metrics side by side so you can make faster, clearer decisions without the guesswork.
Want to keep digging into GA4? These guides might help:
- How to Find Average Session Duration in Google Analytics
- How to Add Annotations in Google Analytics
- Types of Events in Google Analytics (With Examples)
If you have questions or want to join the conversation, you can also find us on X and Facebook.
