Some metrics in GA4 are so buried, it feels like you need a treasure map just to find them.
One of the most frustrating ones was average session duration. I used to rely on it all the time in Universal Analytics to spot weak pages and figure out what was keeping visitors engaged. But in GA4? It’s renamed, hidden, and way too easy to miss.
If you’ve been digging around and still can’t find it, you’re not alone. In this guide, I’ll walk you through exactly how to find average session duration in Google Analytics 4, what the updated metric actually means, and how I track it faster using OnePageGA.
What Is Average Session Duration in GA4?
In Universal Analytics, average session duration told you how long people typically stayed on your site. It was one of those quick-glance metrics that helped me spot which pages were holding attention and which ones weren’t.
In GA4, that metric has been replaced by average engagement time per session, and it works a little differently. I still call it session duration out of habit, but the above label is the correct name.
Instead of counting the total time someone spends from entry to exit, GA4 only tracks active time. If someone opens your site and walks away for five minutes, that idle time doesn’t count.
Even with that change, I still find it useful. If people are leaving after a few seconds, there’s usually a reason. It might be slow loading, poor content, or a mismatch between the page and their search intent. But when I see engagement time ticking up, especially past the one- or two-minute mark, that usually tells me visitors are sticking around, scrolling, reading, and maybe even converting.
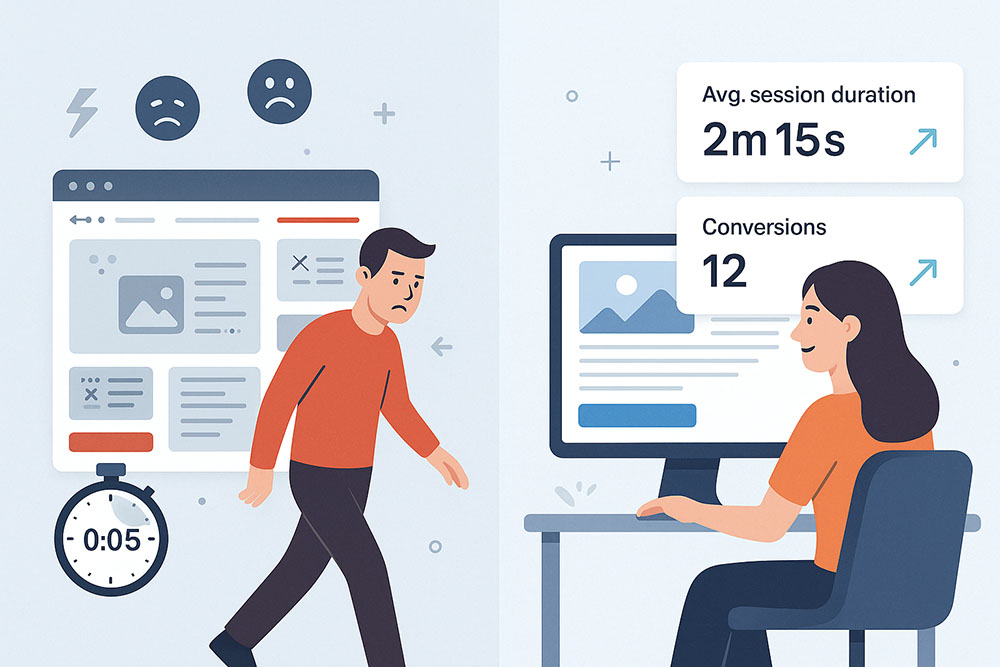
On one of my own landing pages, the average session time was under a minute. After tweaking the headline and moving the CTA higher, people stayed longer and conversions doubled.
Most sites I work with average somewhere between 1 and 2 minutes per session. Databox reports a median of 77.61 seconds for B2B and 92.33 seconds for B2C, which lines up with what I’ve seen. In niches like fintech or SaaS, engagement times often reach 4 to 5 minutes.
If you’re not sure what counts, here’s a simple breakdown of what a metric is in GA4.
Steps for Finding Average Session Duration in GA4
Finding average session duration in GA4 isn’t hard, but it does take a few steps since it’s not included in your default reports.
Here’s how to do it:
Step 1: Open the Engagement Report
First, log into your Google Analytics account.
From the left-hand menu, go to Reports » Engagement » Overview.
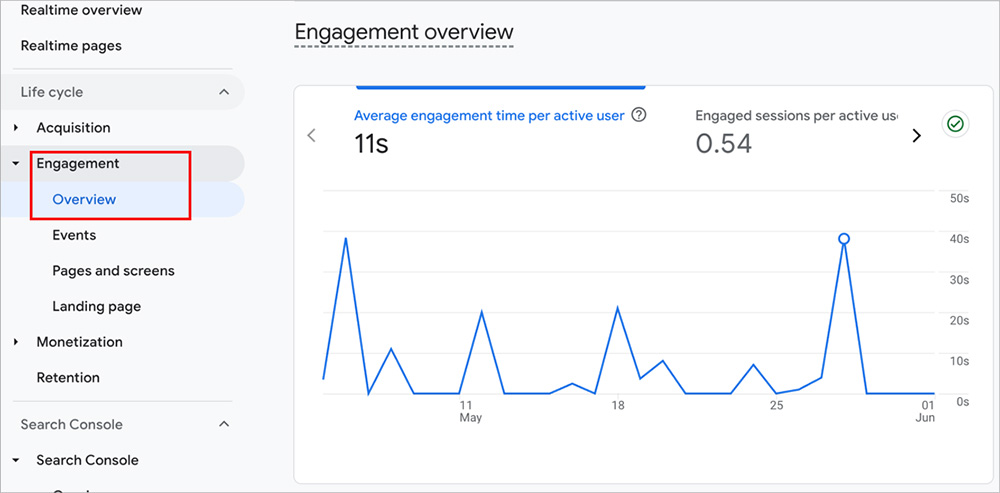
This gives you a general view of how people are interacting with your site, including key metrics like engaged sessions, engagement rate, and engagement time.
If you haven’t used this report before, it’s also where you can track website visitors in GA4.
Step 2: Customize the Report
Once you’re in the Engagement Overview report, look for the pencil icon in the top-right corner of the screen. Click it to enter Edit mode.
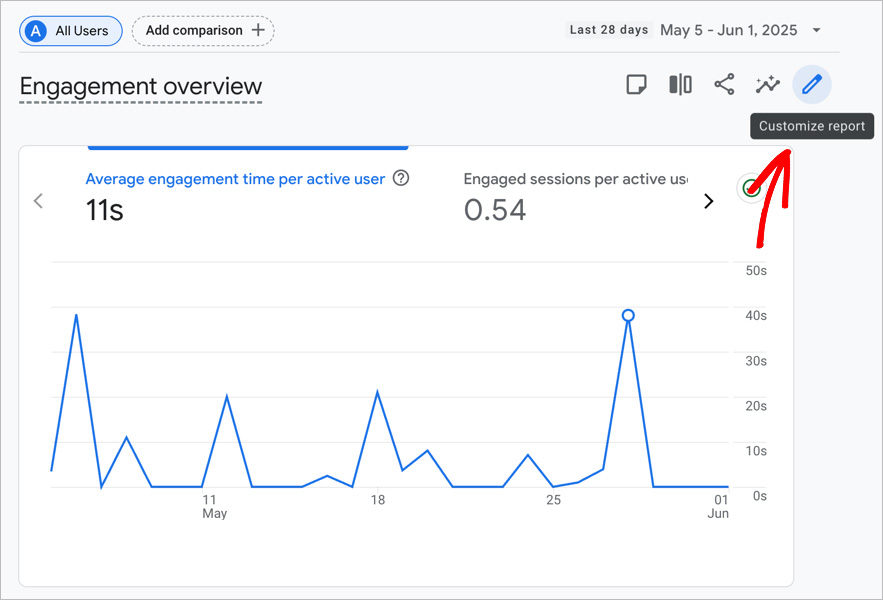
This lets you add or remove metrics from the report, so you can manually include the session duration metric.
Step 3: Add a Session Duration Metric
In the report editor, click on Metrics in the right-hand panel. Then click Add metric.
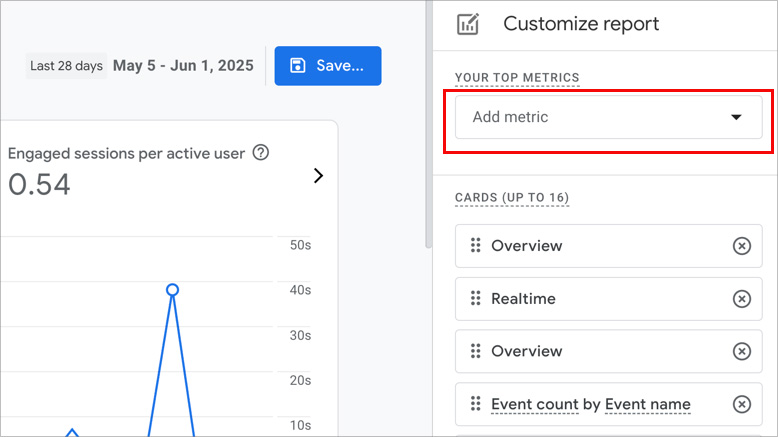
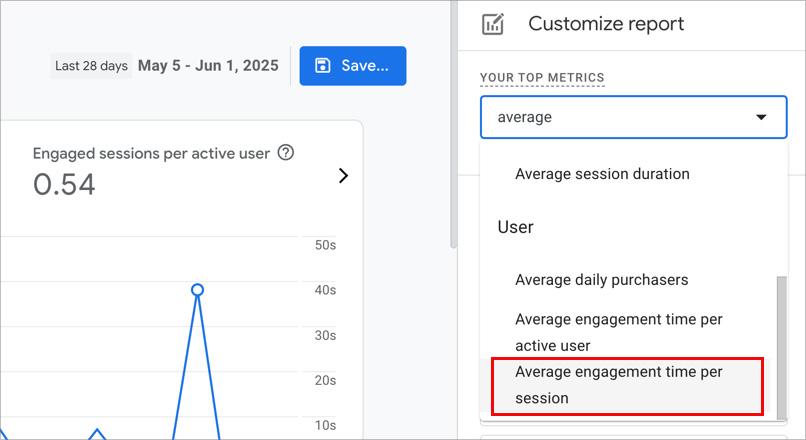
Search for and select Average engagement time per session.
This is the GA4 version of average session duration. It shows how long users were actively engaging with your site during a session, not just how long the tab was open.
Once your report includes the metrics and dimensions you want, click the Save button in the top-right corner.
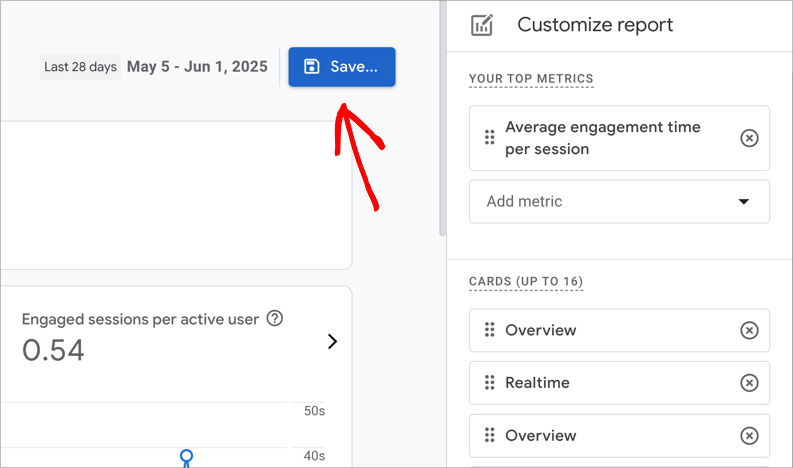
Choose Save as a new report, give it a name like “Session Duration Overview,” and click Save again.
This way, you won’t have to rebuild the report every time you log in. You can find it anytime under Library » Reports.
Step 4: (Optional) Export and Calculate
If you want to match the old Universal Analytics metric more closely, you can calculate it manually.
Click the Share icon at the top of the report, then choose Download file » CSV.
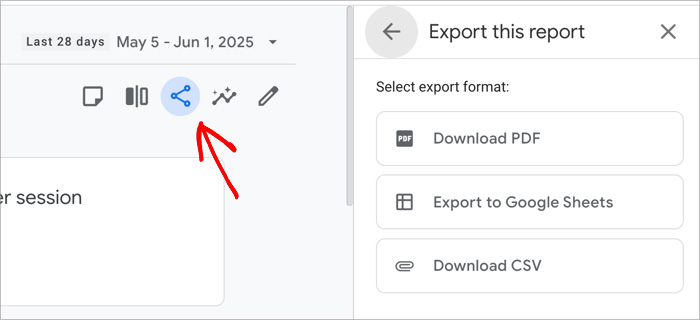
In your spreadsheet, divide the Total engagement time by the Number of sessions. This gives you a rough version of traditional average session duration.
For example, if your report shows 15,000 seconds of total engagement time and 500 sessions, the calculation would look like this:
15,000 ÷ 500 = 30 seconds
So your average session duration would be around 30 seconds.
It’s not perfect, but it can help if you’re comparing old data with your GA4 setup.
Step 5: Add a Secondary Dimension
To dig deeper into your session data, click the “+” icon next to the primary dimension in your report.
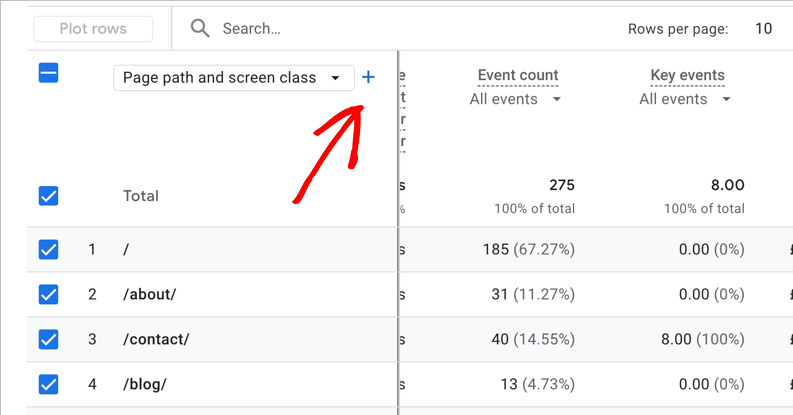
This lets you break down session duration by things like:
- Page path – see which pages are holding attention
- Traffic source – compare how users from search, social, or email behave
- Device category – check whether mobile or desktop users stay longer
Adding a secondary dimension helps you understand not just how long people stay, but also where and why they’re spending that time.
When I compared traffic sources, I noticed users from my newsletter were staying for over 3 minutes, while Facebook traffic dropped off in under 30 seconds. That helped me shift focus to channels that brought in more engaged visitors.
How to View Session Duration in OnePageGA
If you’re tired of jumping through hoops just to see how long people stay on your site, OnePageGA makes it much easier.
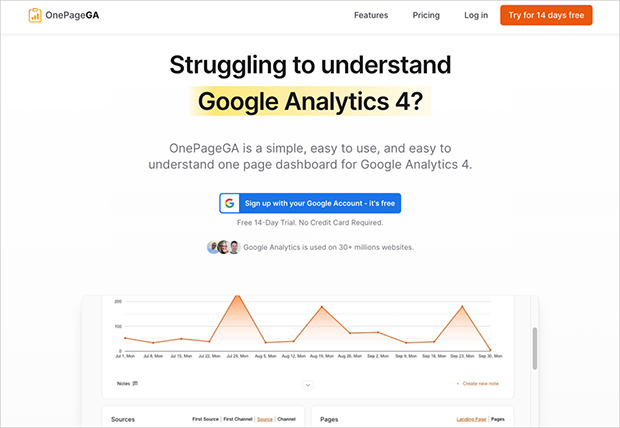
It’s a clean, beginner-friendly dashboard that connects to your GA4 account and helps you create simple GA4 reports without digging through menus. That includes session duration, which shows up right on your main dashboard without any extra setup.
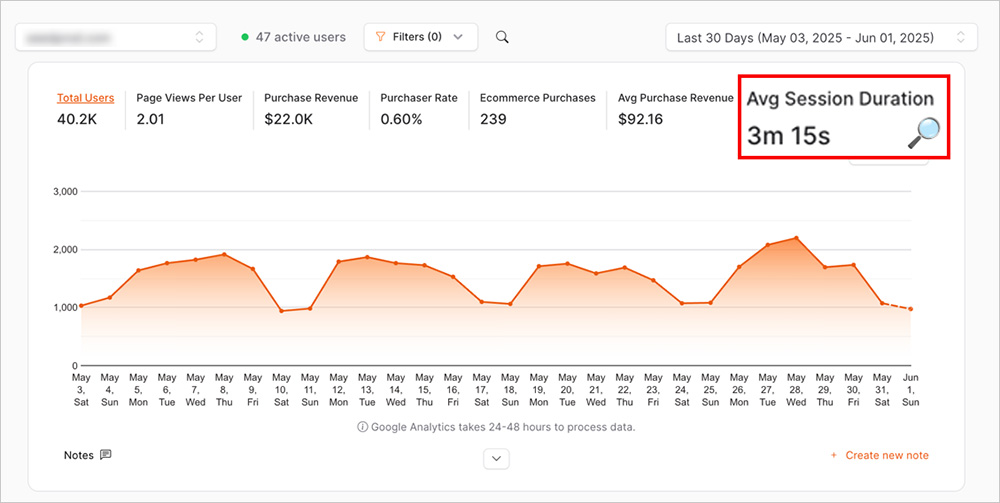
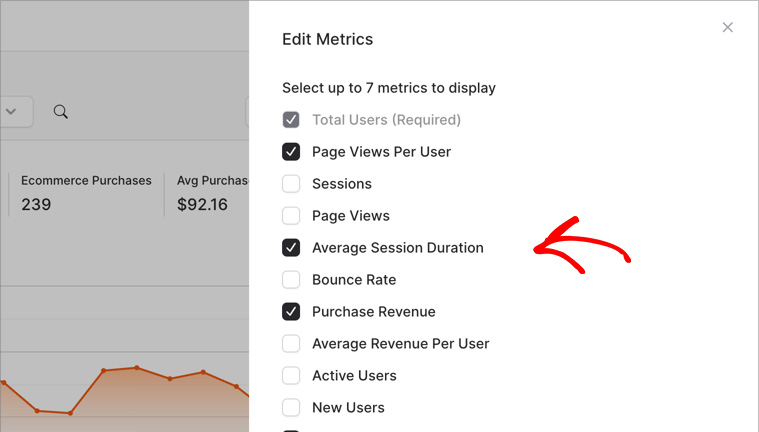
You can also customize your view. Click the Edit Metrics icon and turn on Average Session Duration if it’s not already selected.
From there, you can filter the data by:
- Page
- Traffic source
- Campaign
- Device
I used this to check how different landing pages were performing. Visitors were spending more than 4 minutes on the pricing page, which gave me the confidence to increase my ad budget for that campaign. The numbers helped confirm that the page was doing its job.
With OnePageGA, it only takes a few clicks to see the data that matters most.
Smart Ways to Use Average Session Duration
It’s easy to assume that longer session times are always better, but that’s not always true. Sometimes people stay longer because they’re confused or stuck. Other times, a short session means someone found exactly what they needed right away.
Here’s what I’ve learned from using this metric on my own sites.
What Not to Do
- Don’t assume a longer session automatically means better performance
- Don’t compare GA4 session duration to old Universal Analytics reports — they use different tracking models
- Don’t look at session time on its own. It’s more useful when you pair it with bounce rate, conversion rate, or scroll depth.
What to Do Instead
- Use it to spot weak pages or traffic sources that aren’t bringing in engaged visitors
- Watch for changes over time when you update your content or layout
The European Sealing Association made some key improvements to their site and increased their average session duration to 56 seconds. They also saw a 3% drop in bounce rate and a 51% increase in page views (source). - Compare your numbers to others in your industry to see if you’re in a healthy range
Here are some average session duration benchmarks, based on data from Hike SEO:
| Industry | Average Session Duration |
|---|---|
| Automotive | 2:41 |
| Cybersecurity | 2:49 |
| Fintech | 3:28 |
| Real Estate | 3:52 |
| B2B SaaS | 4:26 |
| Financial Services | 4:56 |
I also like to pair session duration with scroll tracking. You can track scroll depth and other events to get a fuller picture of how people interact with your content.
If visitors are spending time and scrolling to the end, that usually tells me they’re reading and engaging, not just idling with the tab open.
FAQs About Average Session Duration
Why can’t I see average session duration in GA4?
It’s not included in the default reports. You’ll need to customize a report and add Average engagement time per session as a metric.
What’s the difference between engagement time and session duration?
Engagement time only includes active time like scrolling, clicking, or watching a video. It doesn’t count time spent with the tab open in the background.
What’s a good average session duration?
It depends on your niche and content. Most websites average between 1 and 2 minutes. Some industries, like B2B SaaS and financial services, often see 4 minutes or more.
Can I compare GA4 session duration to Universal Analytics?
Not directly. GA4 uses a different tracking model, so the numbers won’t line up. It’s better to treat GA4 as a fresh baseline and focus on trends moving forward.
Wrapping Up: Make Session Time Work for You
Average session duration is still one of the clearest ways to understand how people engage with your website. Even though GA4 makes it harder to find, it’s a metric worth paying attention to.
It helps you see what’s working, where users might be losing interest, and how changes to your content or layout affect real behavior. The key is not just finding the number, but knowing how to use it.
If GA4 feels like too much effort, OnePageGA gives you a faster, simpler way to track session duration alongside all your other key metrics, with no digging required.
Try OnePageGA free for 14 days and see how much easier it is to understand your website performance.
Want to keep learning? Here are some helpful guides to explore next:
- GA4 Pros and Cons: Is It Worth Using?
- Easy Google Analytics 4: A Simple Guide on How It Works
- How to Add Annotations in Google Analytics 4
- How to Find Your Top Converting Traffic Sources in GA4
- Types of Web Analytics Every Website Owner Should Know
If you have questions or want to join the conversation, you can also find us on X and Facebook.

