
In this guide, I’ll make easy Google Analytics a reality for you. You will learn exactly how the platform works, how to set it up, and how to quickly get the insights you need to grow your business.
Put simply: Google Analytics 4 works by using a unique tracking ID to record how visitors interact with your site. To set it up, you just need to create a free Google account, generate your “G-” tracking code, and add it to your website’s header.
What Exactly Does Google Analytics Do?
Google Analytics shows you what people are doing on your website. It tells you where they come from (like Google Search, Facebook, or other websites), what device they’re using (computer, phone, or tablet), and where they’re located.
GA4 also tracks what pages they visit, how long they stay on each page, and if they do things like fill out a form or buy something. Basically, it helps you understand how people use your website so you can make it better.
How to Use Google Analytics 4
Many website owners find the amount of data in GA4 overwhelming. The platform has a steep learning curve, and the interface can be complex for beginners.
However, once you know where to look, GA4 is a valuable asset for your business. In this tutorial, I will simplify the setup process and show you exactly what to focus on.
Let’s dive in.
Step 1. Create a Google Analytics Account
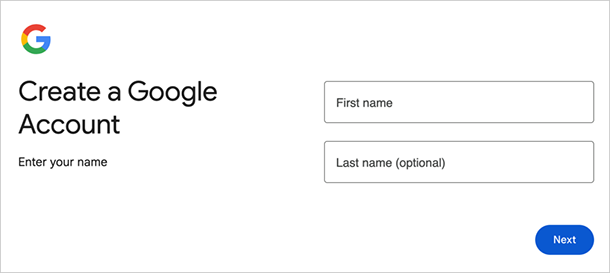
First, you’ll need a Google account. If you already use Gmail, Drive, or any other Google service, you’re good to go. If not, head over to accounts.google.com and create one. It’s quick and free.
Next, visit the Google Analytics website and click the “Start measuring” button. From there, follow these steps to configure your account:
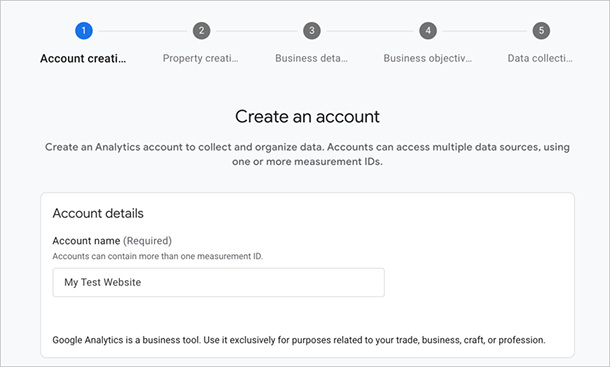
- Account Name: Enter your business or website name. Configure the data-sharing settings and click Next.
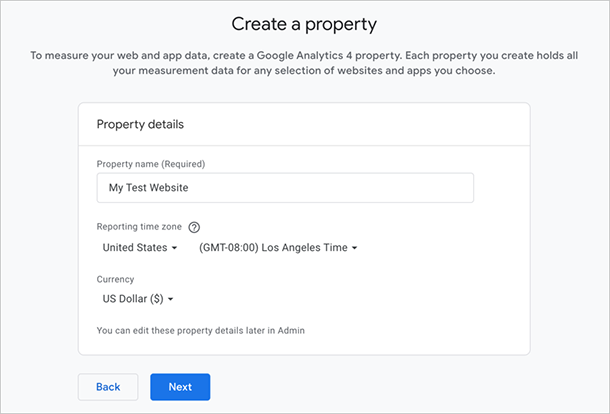
- Property Name: Enter your website name again. Select your reporting time zone and currency.
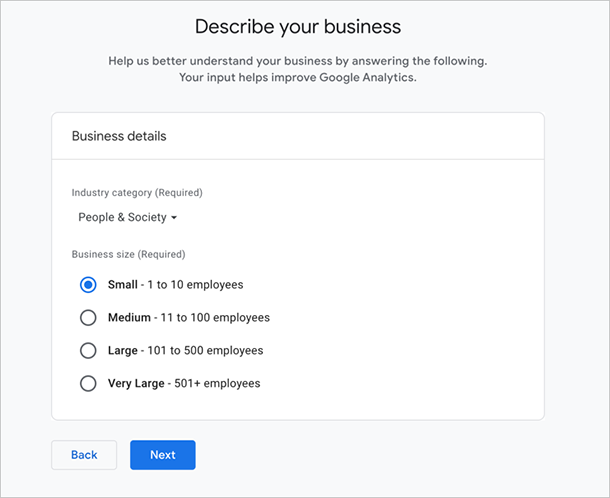
- Business Details: Select your industry category and business size.
- Business Objectives: Choose what you want to achieve (Leads, Sales, Traffic, or User Engagement). This tailors your reports.
- Platform: Select “Web” to set up tracking for a website.
From there, you’ll need to enter your website’s URL and name. Once you’ve done this, click “Create and Continue”.
Step 1. Create a Google Analytics Account
First, you’ll need a Google account. If you already use Gmail, Drive, or any other Google service, you’re good to go. If not, head over to accounts.google.com and create one. It’s quick and free.
Next, visit the Google Analytics website and click the “Start measuring” button.

You’ll be asked to name your account (usually your website name) and set your account data-sharing settings before clicking next.
Then, enter your property name (such as your site’s name), time zone, and currency.
After this, Analytics will ask for your business industry and size.
The next screen asks you to choose your business objectives. This will help tailor your reports to the metrics that matter most to your business.
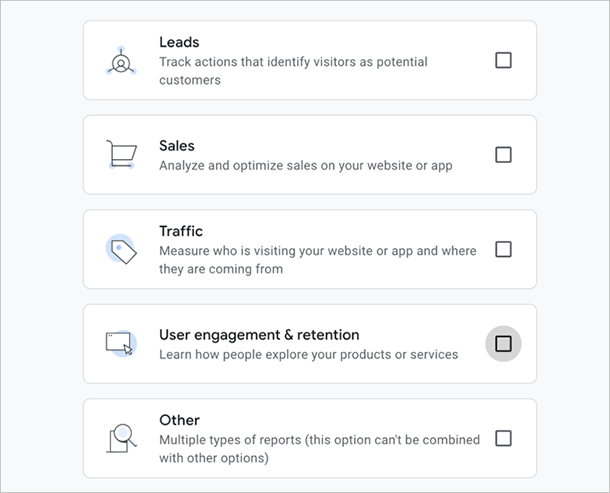
Here, you can select any of the following:
- Leads
- Sales
- Traffic
- User engagement & retention
- Other
The last step is to choose a platform to collect data from. Since you’re setting up Google Analytics for a website, click the “Web” option.
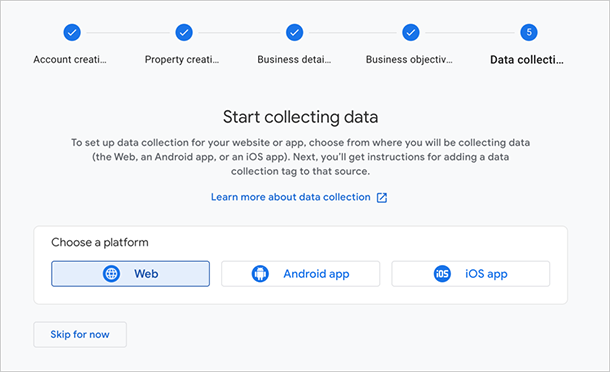
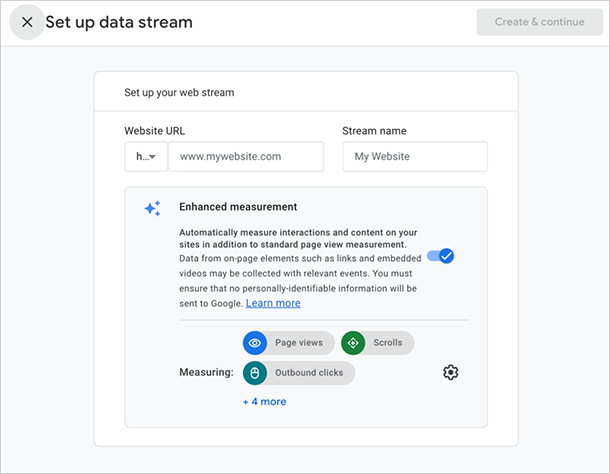
From there, you’ll need to enter your website’s URL and name. Once you’ve done this, click “Create and Continue”.
Google will now provide you with a unique tracking ID, a string of characters that starts with “G-.” This ID tells Google which website to track.
You’ll need to add this tracking ID to your website, which I’ll go into in more detail next.
Step 2. Add the Tracking Code to Your Website
Now that you have your GA4 account and tracking ID, it’s time to connect it to your website.
There are a few ways to add the tracking code to your website. If you’re using a website builder like WordPress, the easiest method is with a plugin.
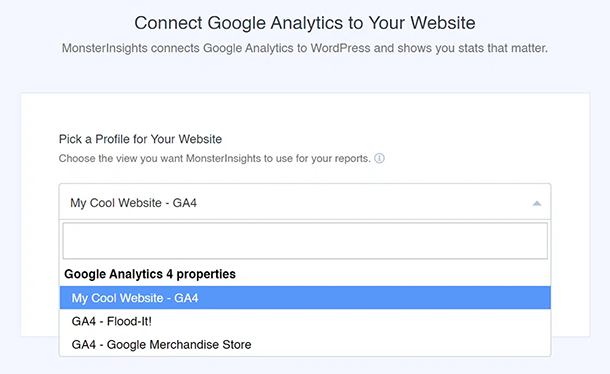
I recommend MonsterInsights, one of the best Google Analytics plugins for WordPress. I use it on my own sites, and it’s super simple.

I recommend using a plugin because manually placed code is often deleted during theme updates. If you paste the code into your theme files and then update your theme, you will lose your tracking data. A plugin prevents this issue.
For a full walkthrough, please see their guide on How to Add Google Analytics to WordPress.
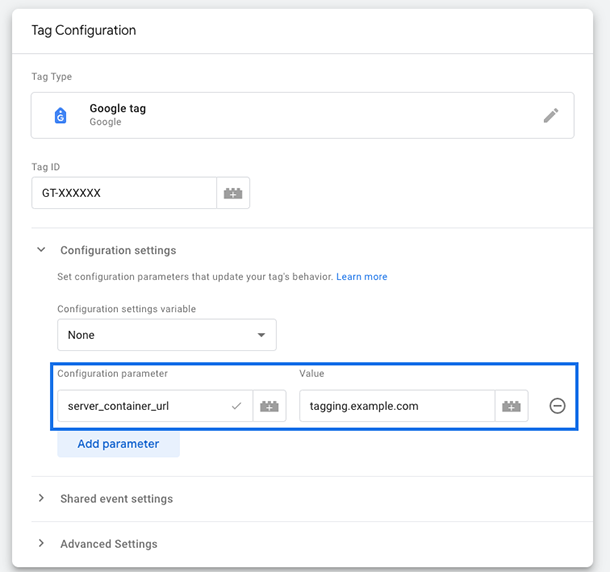
Another popular option is Google Tag Manager. This tool allows you to manage all your website tags (including your GA4 tracking code) in one place. It’s a bit more advanced, but it gives you greater flexibility and control.
If you’re not using WordPress or prefer a more hands-on approach, you can add the tracking code directly to your website’s HTML. Google Analytics provides instructions for this, but it’s generally best for users comfortable editing code.
The tracking code needs to be added to every page you want to track, usually within the <head> section of your HTML. It’s a small snippet of code, but it’s essential for collecting data.
For a full walkthrough of different methods, see this guide on how to add Google Analytics to your website.
Step 3. Enable Key Events (Conversion) Tracking
If you want Google Analytics to tell you how many visitors are taking action on your website (like signing up for your newsletter, filling out a form, or buying a product), you need to set up tracking for key events.
In the past, these were called “conversions.” Google now refers to them as “Key Events.”
GA4 can automatically track some of these things, like file downloads and video views, with its “Enhanced Measurement” feature. But there are a few limitations.
For example, the video tracking works best with embedded YouTube videos, and the form tracking might have issues if you’re also using a Facebook Pixel.
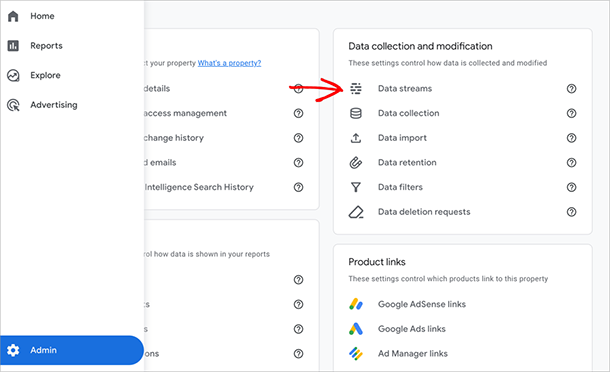
To turn on Enhanced Measurement, click the Admin cog at the bottom left of your GA4 screen, then click the “Data Streams” option.
Here, click on your website’s data stream.
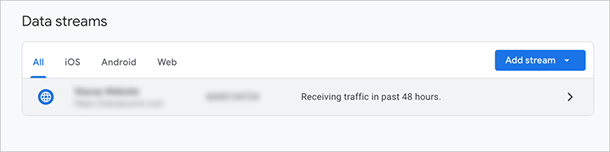
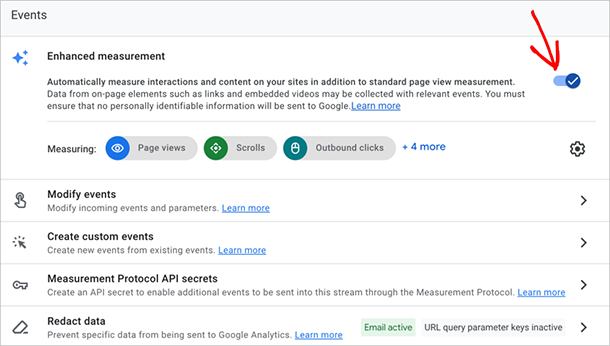
Then, you’ll see the “Enhanced Measurement” section. Make sure it’s switched on. This allows GA4 to automatically track the following interactions:
- File downloads
- Page views
- Scrolls
- Outbound clicks
- Site search
- Video engagement
Now, you can tell GA4 which of these automatically tracked events you want to count as your most important goals.
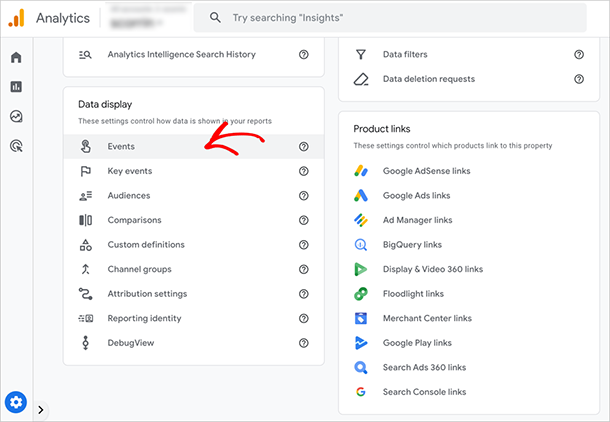
To do this, go back to the Admin cog and click “Key Events”.
A Quick Guide to GA4 Reports
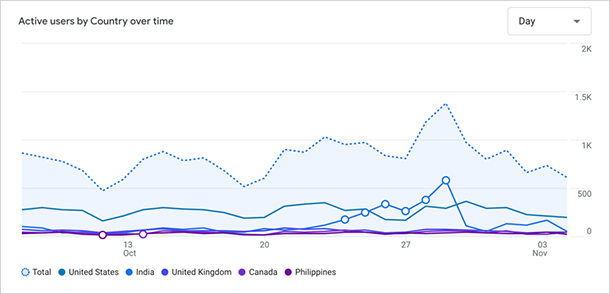
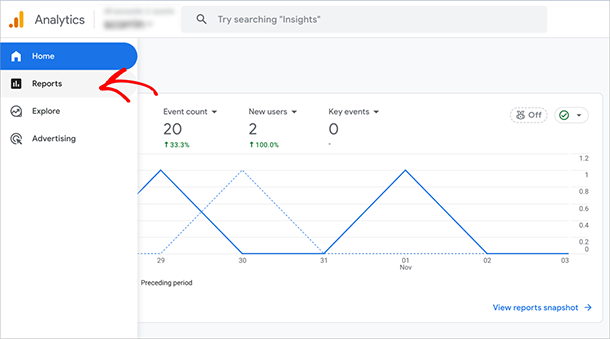
Once you’ve set up GA4, you can access its reports to understand your website’s performance. When you first log in, you’ll see the home dashboard, which gives you a quick overview of key metrics like users, new users, engagement time, and event count.
On the left-hand side, you’ll find the navigation menu. Click “Reports” to access a deeper dive into your website’s data.
Realtime Report
This report shows you what’s happening on your website right now. How many people are on your site at this very moment? What pages are they looking at?
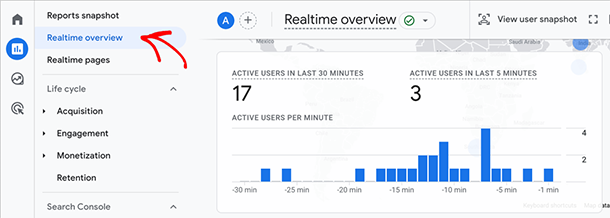
This report is great for tracking the immediate impact of a new campaign or social media post.
Note: While the Realtime report works instantly, the other reports can take 24-48 hours to start showing data after you first set up Google Analytics.
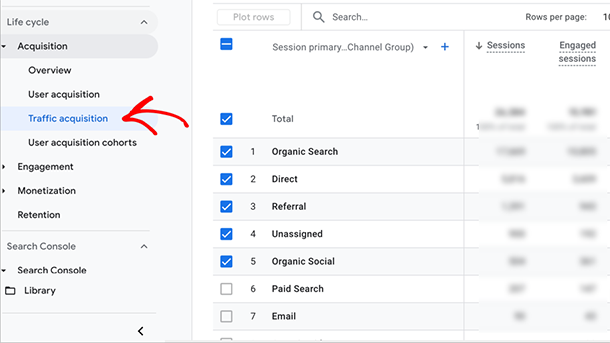
Acquisition Report
This report tells you where your visitors are coming from (Google Search, social media, other websites, or direct traffic).
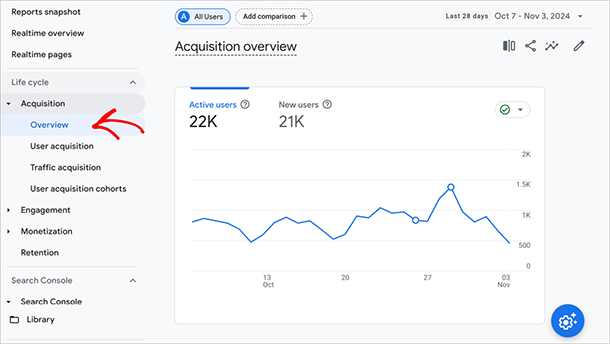
This helps you understand the most effective marketing efforts and where to focus your resources. If you drill down into this report, you can see which specific sources drive the most traffic to your site.
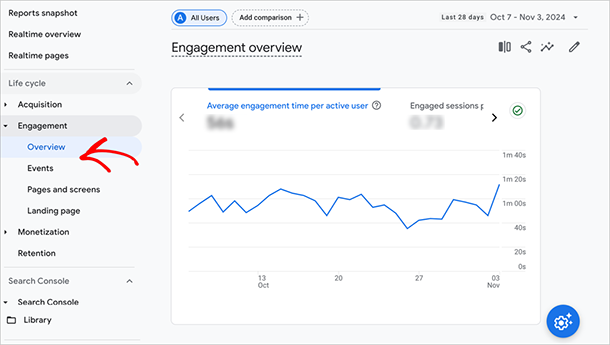
Engagement Report
This report shows you what people are doing on your website. A key metric here is the Engagement Rate.
An “engaged session” is defined as a session that lasts longer than 10 seconds, has a conversion event, or has at least 2 pageviews. The Engagement Rate is simply the percentage of sessions that meet these criteria.
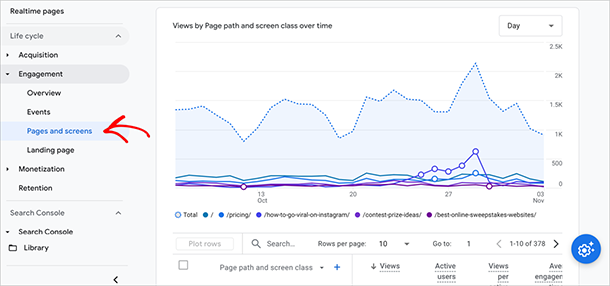
The Pages and Screens report is particularly useful here, showing you metrics for each page on your site.
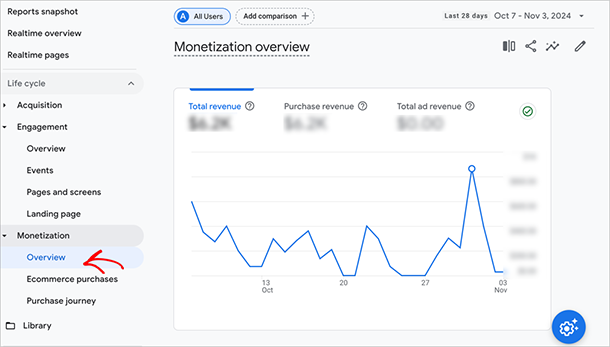
Monetization
If you sell products online, the monetization report tracks sales data, revenue, and other key e-commerce metrics. To use it effectively, you’ll need to set up e-commerce tracking.
Demographics and Tech Reports
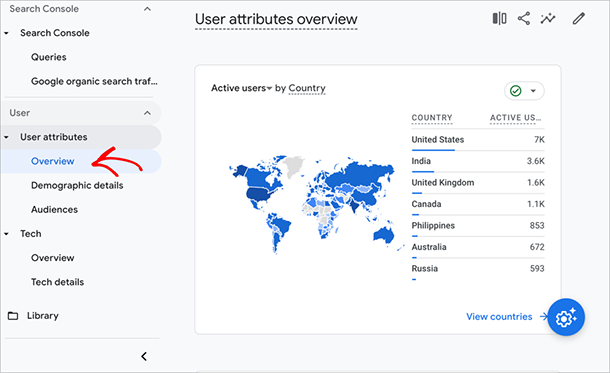
The Demographics report provides information about your audience, such as age, location, gender, and interests.
Similarly, the tech report details the technology they use to access your website, such as the device type, browser, and operating system.
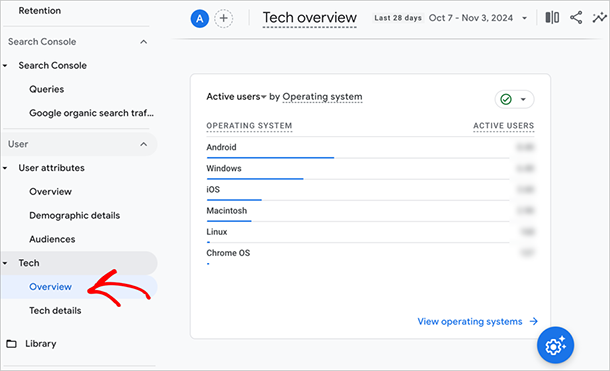
With this information, you can tailor your content and marketing efforts to suit the type of audience interested in your business.
Now, this is a very simplified overview of how reporting works in GA4. You can find more information by digging into individual reports, parameters, and specific audiences.
However, this can quickly become confusing. That’s why, next, I’ll introduce an easier way to find the metrics that matter most to a growing business website.
Get Easy Google Analytics Reports
Many website owners wish there was a simpler way to see the most important metrics about their website’s performance without digging through complex reports and data they don’t understand. They want a clear, concise overview of what’s working and what’s not.
That’s where OnePageGA comes in.
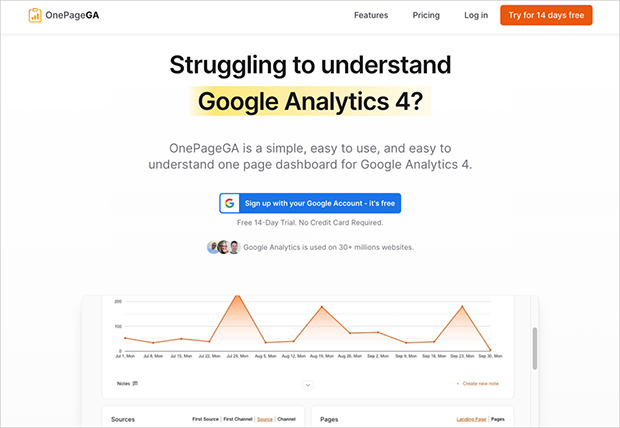
It’s a simple, easy-to-use, one-page dashboard for Google Analytics 4 that brings back the simplicity and clarity of the old Google Analytics.
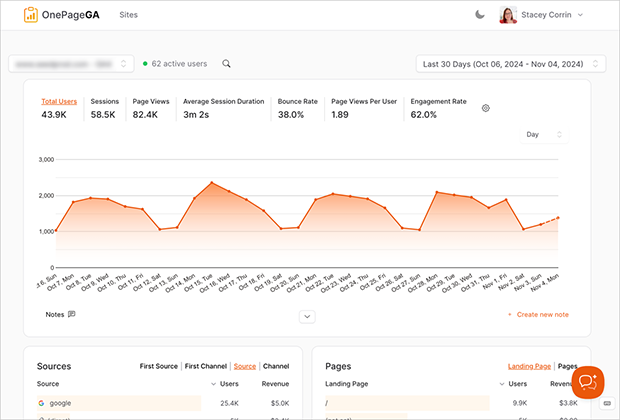
With OnePageGA, you see all the key metrics on a single page at a glance. No more clicking through endless reports.
You’ll see only the metrics that truly matter for growing your business so you can quickly identify what needs attention.
Setting up OnePageGA is quick and easy. Just connect your GA4 account, and you’re ready to go in minutes. No complicated settings to configure.
You also get pre-built Google Analytics reports designed to give you instant, actionable insights. This saves you valuable time and effort, allowing you to focus on improving your website.
FAQs About Easy Google Analytics
Is Google Analytics 4 free?
Yes, Google Analytics 4 is completely free for standard use. There is a paid version called Analytics 360, but this is designed for very large enterprises.
Is Google Analytics easy?
Google Analytics is easy once you learn the basics.
You only need to understand a few core reports like traffic, pages, and conversions to get real value. Tools like OnePageGA make this simpler because they show your top insights in plain language.
What is Google Analytics for beginners?
Google Analytics for beginners is a simple way to track who visits your site and what they do.
You’ll see where your traffic comes from, which pages get views, and which actions lead to conversions. It gives you the data you need to improve your content and grow your site over time. Tools like OnePageGA help break these reports into clear steps so you always know what to look at next.
Get Started with Easy Google Analytics
We’ve covered a lot in this guide, from setting up your GA4 account to understanding its various reports. While GA4 can be powerful, it can also be overwhelming.
Remember, the goal is to use your website data to make informed decisions and grow your business. Don’t get bogged down in the complexity of GA4. Focus on the metrics that matter most to you.
If you’re looking for a simpler, more streamlined way to access and understand your Google Analytics data, give OnePageGA a try. It’s designed to make GA4 easy, even for beginners.
Ready to get easy Google Analytics and start seeing real results?
Get started with OnePageGA today.
If you have questions or want to join the conversation, you can also find us on X.
