The first time I opened GA4, I thought bounce rate was gone.
I was trying to figure out why one of my landing pages wasn’t converting. I went straight to where bounce rate used to live, but it wasn’t there. No column. No toggle. Nothing.
If you’ve had that moment of confusion too, you’re not imagining it. GA4 hides bounce rate by default, and it doesn’t work the same way it did in Universal Analytics.
In this guide, I’ll show you how to find bounce rate in GA4, how the new version works, and the faster way I check it now without customizing reports every time.
What Is Bounce Rate in GA4?
Bounce rate in GA4 works differently than it did in Universal Analytics. Instead of measuring how many people left your site without visiting another page, it now looks at engagement.
In GA4, bounce rate is the percentage of sessions that weren’t considered “engaged.” So a session counts as a bounce if the visitor:
- Stays on your site for less than 10 seconds
- Doesn’t trigger any conversion events
- Views only one page or screen
If none of those things happen, GA4 marks the session as a bounce.
Here’s the formula:
Bounce Rate = 100% minus Engagement Rate (Source: Google Support)

For example, let’s say someone lands on your homepage, scrolls a bit, but leaves after five seconds without clicking anything. That’s a bounce. But if they hang around longer, view another page, or submit a form, the session is marked as engaged and won’t count as a bounce.
Step-by-Step: How to Find Bounce Rate in GA4
GA4 doesn’t show bounce rate by default, so you’ll need to add it manually to your reports. You can add it in just a few clicks.
Step 1: Go to the Right Report
Log into your Google Analytics account, then go to Reports » Engagement » Pages and screens
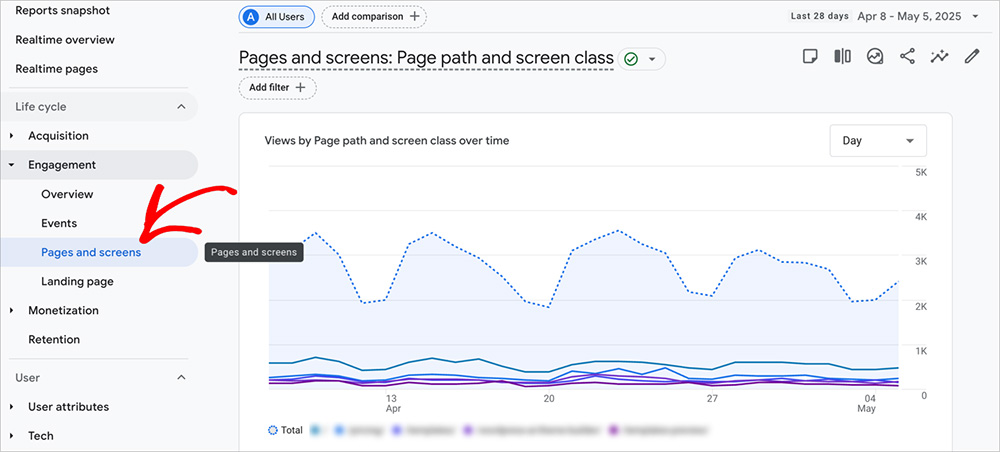
This is where you’ll see how individual pages are performing.
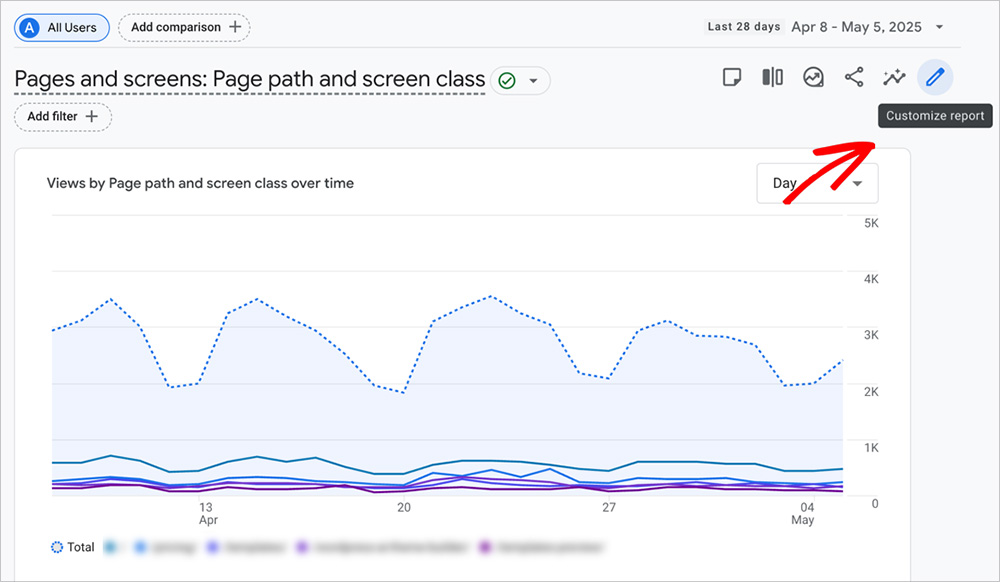
Step 2: Click the Edit Icon
In the top-right corner of the report, click the pencil icon to customize the report layout.
Step 3: Add Bounce Rate
In the panel on the right, look for the Metrics section. Click into it, then search for “Bounce rate.”
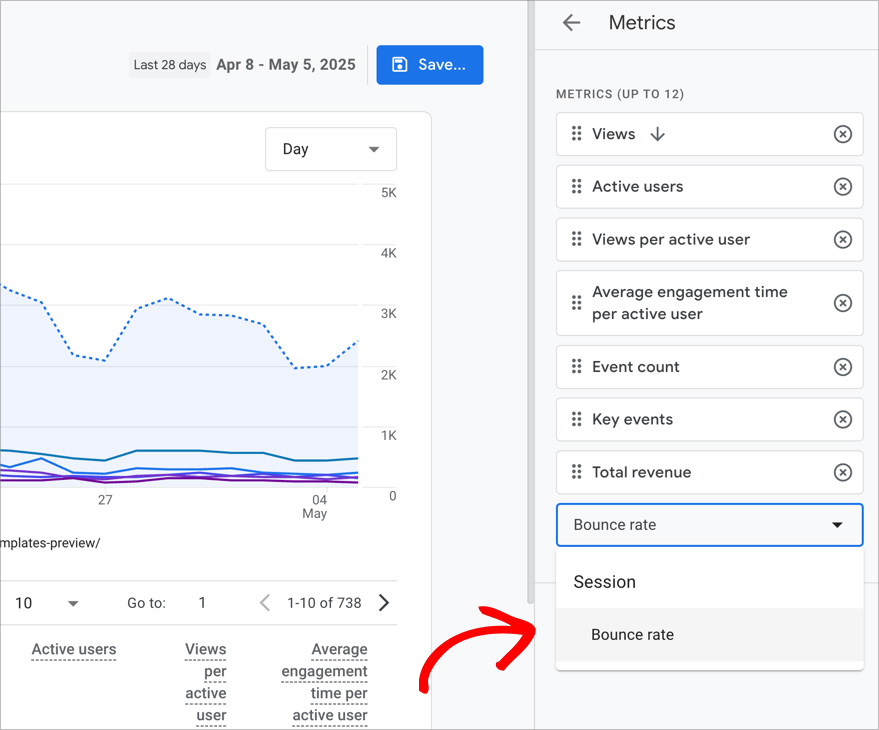
Once you see it, click to add it to the report.
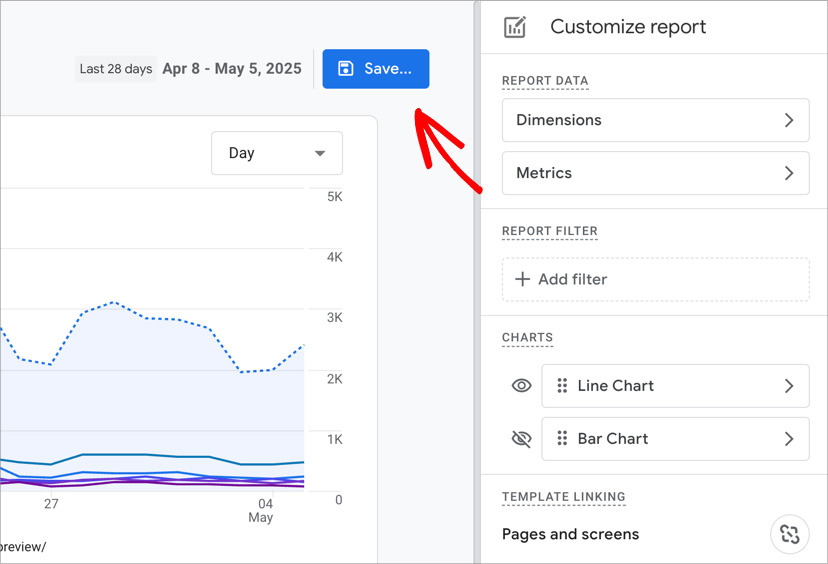
Step 4: Apply and Save
Click Apply, then hit Save at the top of the page.
Step 5: View and Explore Your Data
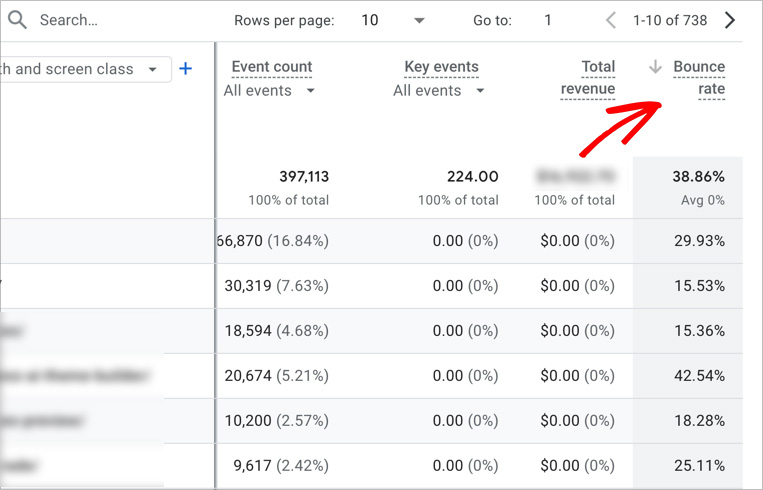
Now, scroll through the table to see the bounce rate for each page.
Click the Bounce rate column header to sort it from highest to lowest.
You can also click the + icon above the table to add a second dimension like traffic source, device type, or landing page path.
A Simpler Way: Track Bounce Rate with OnePageGA
GA4 makes it harder than it should be to find simple stats. That’s why I use OnePageGA to track my website analytics.
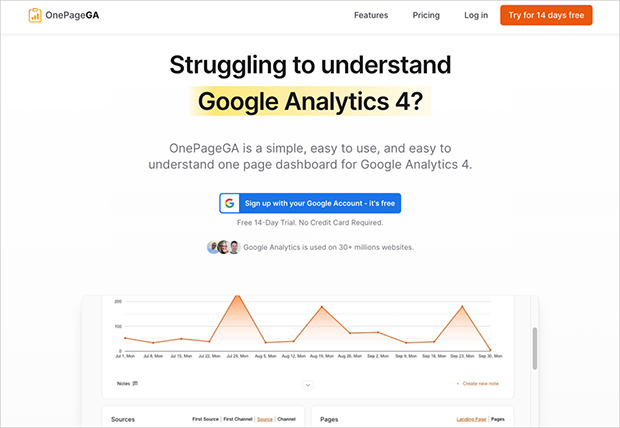
It connects to your Google Analytics account and shows your key metrics on a single page, including bounce rate, with no need to edit reports or click through menus.
Bounce rate is included by default, right alongside sessions, users, conversions, and revenue.
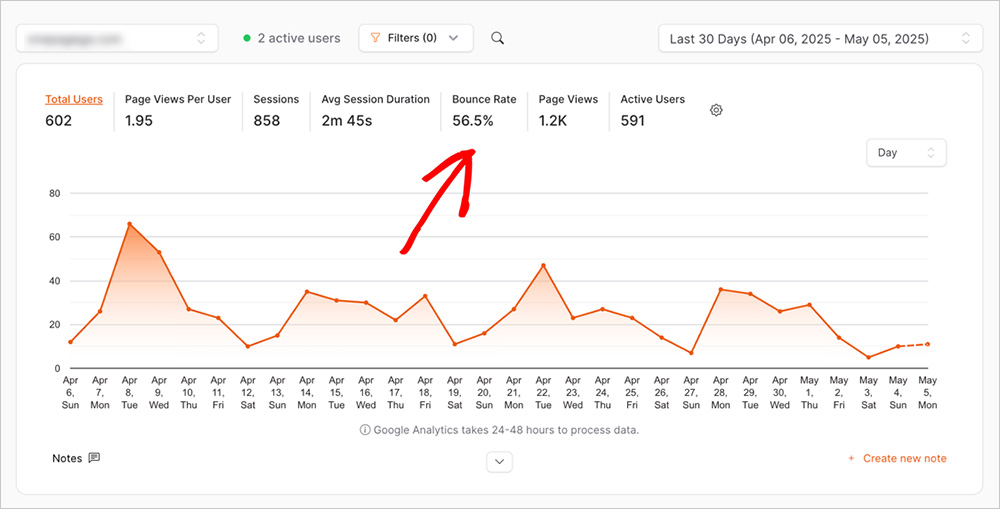
You can filter everything by:
- Page
- Source/medium
- Campaign
- Device
This makes it easy to spot pages with high bounce rates and start asking why. You might test a different layout or update your copy to keep people on the page longer.
With OnePageGA, there’s no need to change any settings or remember where to find things. All the key stats are waiting as soon as you log in.
Smart Ways to Use Bounce Rate in GA4
Bounce rate can be useful, but only if you know how to read it. A high number doesn’t always mean something’s wrong, and a low one doesn’t always mean everything’s working.
What to Avoid
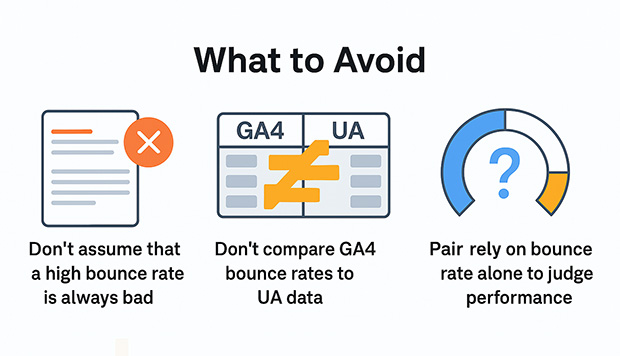
- Don’t assume that a high bounce rate is always bad. Some pages are meant to be short visits, like a contact page or blog post. For example, blog posts often see bounce rates over 70%, which is considered normal in many industries.
- Don’t compare GA4 bounce rates to your old Universal Analytics data. GA4 uses a completely different definition based on engagement, so the numbers won’t match.
- Don’t rely on bounce rate alone to judge performance. It doesn’t tell you why someone left, just that they didn’t stay long or interact.
What to Do Instead
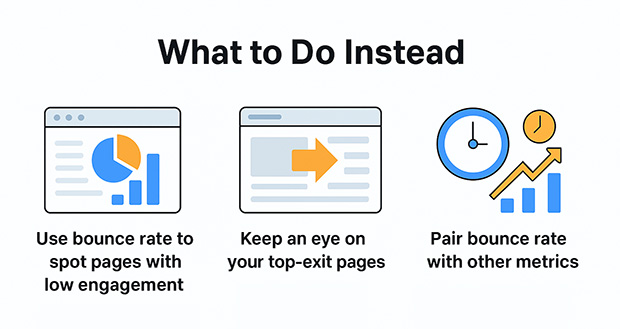
- Use bounce rate to spot pages with low engagement. Pages with bounce rates over 70–80% and little conversion activity are worth a closer look.
- Keep an eye on your top-exit pages. If visitors are consistently leaving from a particular page, it might point to friction or confusion. According to Hotjar, high exit rates can be a sign that users didn’t find what they were looking for or hit a dead end.
- Pair bounce rate with other metrics like time on page, scroll depth, and conversion rate. A low time on page and high bounce rate often means the content didn’t match what visitors were expecting.
Bounce rate is a starting point. It helps you spot red flags and test improvements. Most of all, it helps you ask better questions about how people are using your site.
FAQs About GA4 Bounce Rate
Why can’t I see bounce rate in GA4?
It’s not included by default. You have to manually add it to your reports using the customization options in the Pages and Screens report.
What’s a good bounce rate?
It depends on the type of content. Blog posts and news articles might have bounce rates over 70 percent, which is completely normal. Sales or product pages should usually aim for under 50 percent, especially if you want visitors to take action.
Is a high bounce rate always bad?
Not always. If someone reads a full blog post and then leaves, that counts as a bounce, but it might still be a successful visit. What matters is whether the page did what it was supposed to do.
Can I compare GA4 bounce rate with Universal Analytics?
No. The calculation is different, so the numbers won’t match. GA4 bounce rate is based on engagement, while Universal Analytics measured it based on single-page sessions. They track different behaviors.
Track Bounce Rate the Easy Way
Bounce rate didn’t disappear in GA4, but it is harder to find. You can still access it with a few quick steps, and once you know where to look, it’s easier to track over time.
That said, GA4 isn’t always the most user-friendly. If you want a faster way to check bounce rate and all your other key metrics in one place, OnePageGA can help.
Start your 14-day free trial and take the guesswork out of GA4.
If you’re working on understanding GA4 or making your reports easier to read, these guides might help:
- Easy Google Analytics 4: A Simple Guide on How It Works
- How to Create Simple Google Analytics Reports
- What Is a Metric in Google Analytics (And What to Track)
- How to Find Your Top Converting Traffic Sources in GA4
- Types of Events in Google Analytics + How to Use Them
If you have questions or want to join the conversation, you can also find us on X and Facebook.
