
When I was new to marketing, Google Analytics was an alien concept to me.
I’d heard it was crucial for understanding my visitors, but honestly, just looking at it made my head spin. All those charts, tables, and numbers, it felt like trying to decipher a code I didn’t have the key to.
I just wanted the basics: Who was visiting? What were they looking at? And were they finding what they needed? It was, to say the least, incredibly frustrating.
If that sounds familiar, you’re definitely not alone. Many website owners and marketers find Google Analytics overwhelming. We all need clear, actionable insights, but getting them shouldn’t be such a headache.
That’s why I’m writing this guide: to show you how to create simple Google Analytics reports that actually make sense and help you achieve your goals.
What Are Reports In Google Analytics?
Google Analytics reports are your website’s story told through numbers. They’re organized summaries showing exactly what’s happening on your site, from who’s visiting to what they’re doing.
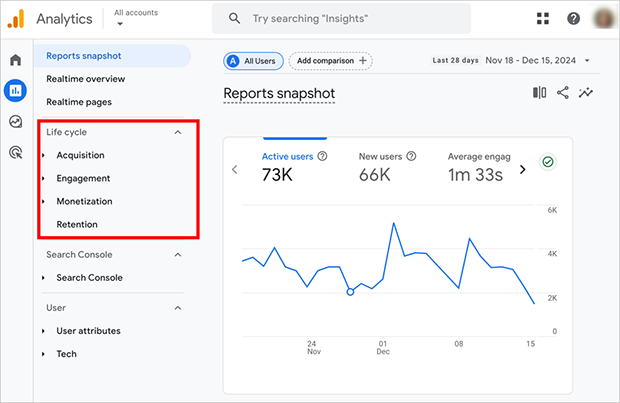
Google Analytics organizes these reports into five main categories:
- Audience Reports: Who’s visiting your site
- Acquisition Reports: How they found you
- Behavior Reports: What they do on your site
- Conversion Reports: Whether they take desired actions
- Real-Time Reports: What’s happening right now
Each of these categories answers specific questions about your visitors and their actions.
But here’s the catch: while these reports are powerful, they’re also overwhelming. GA4’s complexity often stands between you and the information you need.
Let’s look at why that happens.
Why Is Google Analytics 4 So Complicated?
Google’s move to GA4 in 2023 significantly changed how we analyze website data, and it’s been a difficult transition for many. Even experienced marketers sometimes struggle with the new terminology and layout.
While terms like “bounce rate,” “sessions,” and “pageviews” might seem simple at first glance, understanding how they all interact requires a lot of learning.
Also, standard reports don’t always have the information you need. You’re forced to use custom reports if you want to track unique customer journeys or combine metrics in a meaningful way.
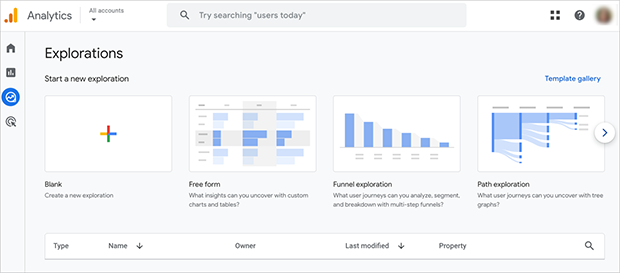
And creating custom reports in GA4 is quite complex. You need to know about dimensions, metrics, filters, and different report types.
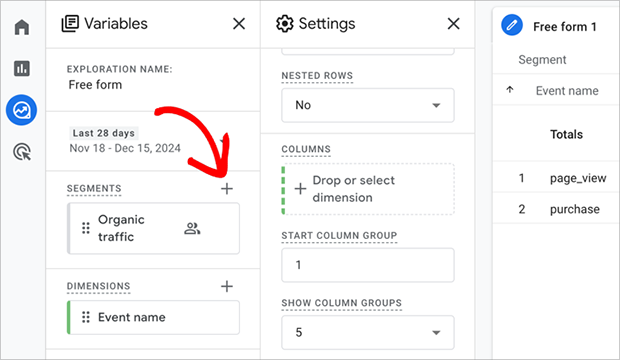
This kind of customization can quickly become overwhelming.
Because of these challenges, many users find themselves spending less time on their marketing efforts and more time figuring out their website data.
So how do you create simple Google Analytics reports that give you the information you need quickly?
Let’s find out.
The Easy Way to Create Simple Google Analytics Reports
Several web analytics tools have popped up on the market attempting to solve the complexity of Google Analytics 4. But in my opinion, many of them pose the same problems. Learning to use them often feels just as hard as using GA4 itself, requiring you to learn a whole new system and interface.
If you’re looking for a solution that doesn’t require learning a whole new platform, then OnePageGA is the answer. It’s designed to be intuitive and straightforward, without the learning curve of GA4 or other alternatives.
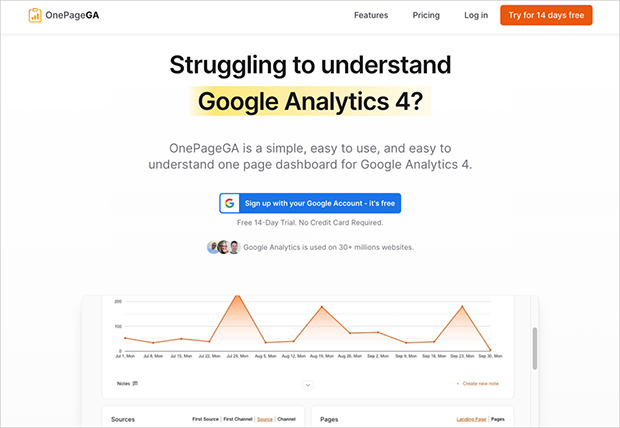
OnePageGA is a one-page Google Analytics 4 dashboard that gives you simple, easy-to-understand reports about your website’s performance. Instead of GA4s complexity, you get all the essential insights you need in one place.
Here’s what makes OnePageGA different:
- You won’t need training or tutorials to understand how to use it. It’s designed to be intuitive.
- All your core metrics are available on a single page, removing the need to click through endless menus.
- Get key reports like website visitors, popular pages, and traffic sources automatically.
- You don’t need to be a technical expert to set it up or understand it.
- If you need something different, you can easily create custom reports.
To get started with OnePageGA’s simpler reporting, follow these easy steps.
Note: Before diving in, you’ll need to set up GA4. Here’s a simple guide on how to add Google Analytics to your website.
Step 1. Sign Up With Your Google Account
First, go to the OnePageGA website and click the button titled “Try for 14 days free”.
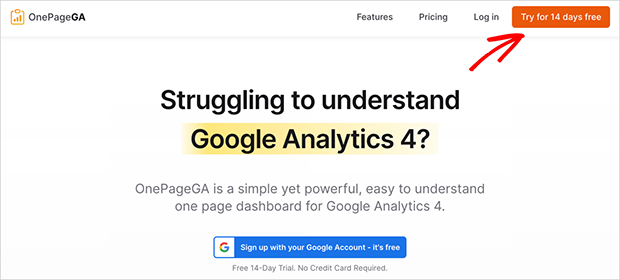
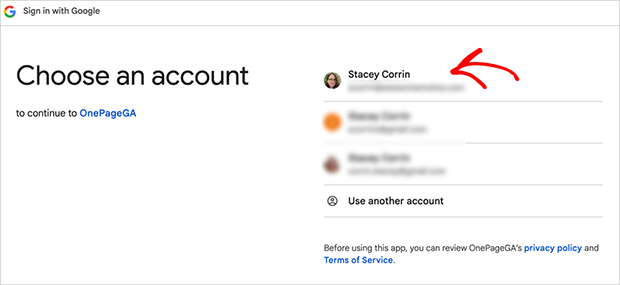
This will prompt you to connect to the platform using your existing Google account.
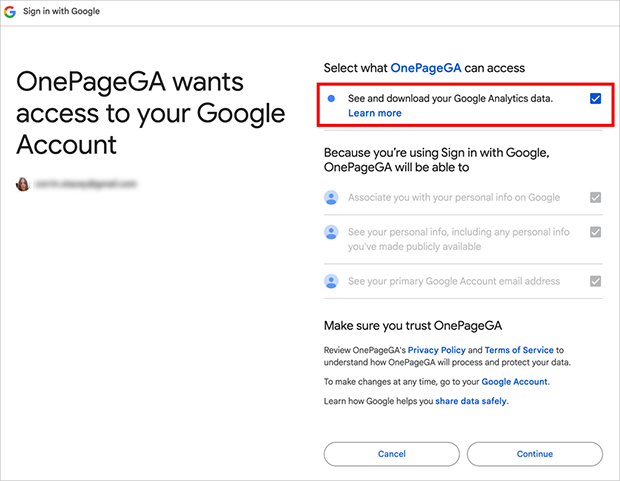
On the next screen, confirm your data sharing settings and click “Continue”.
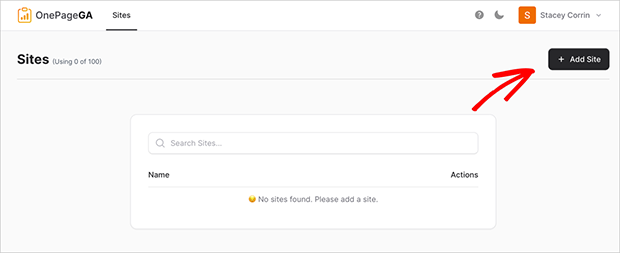
Finally, you’ll head to your OnePageGA dashboard, where you can select a website to track.
Step 2. Add Your Website to OnePageGA
To add a new website to your account, click the “Add Site” button.
Then, go ahead and select your Google Analytics property from the dropdown menu and click “Next”.
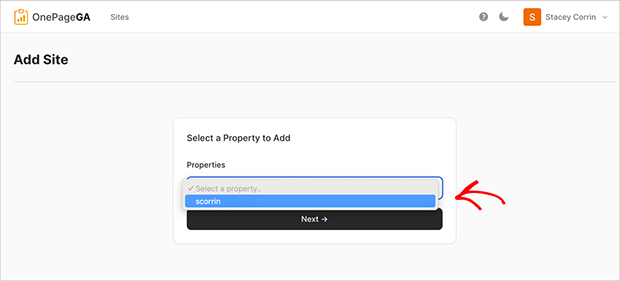
That’s all there is to it. OnePageGA will now take you to your single-page Google Analytics dashboard, where you can see your simplified reports.
Step 3. View Your Simple Google Analytics Reports
When you open your OnePageGA dashboard, you’ll immediately see a graph of your site’s performance. This includes key metrics like page views, sessions, how long people stay on your site, and your bounce rate.
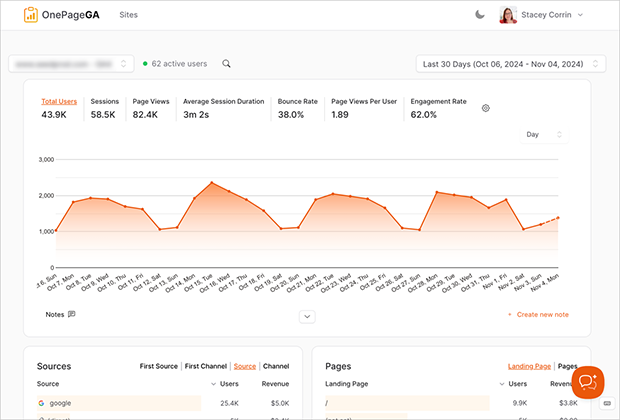
All of this is in one simple view, so you can quickly see what is and isn’t working on your website.
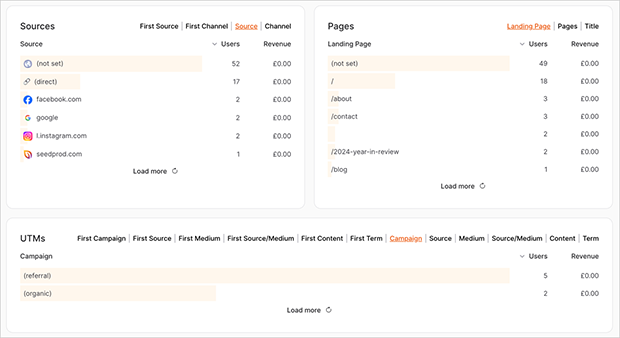
Under this graph, you’ll see several other simple GA4 reports which tell you even more about your site’s performance, including:
- Where your traffic comes from, so you know which channels are working best.
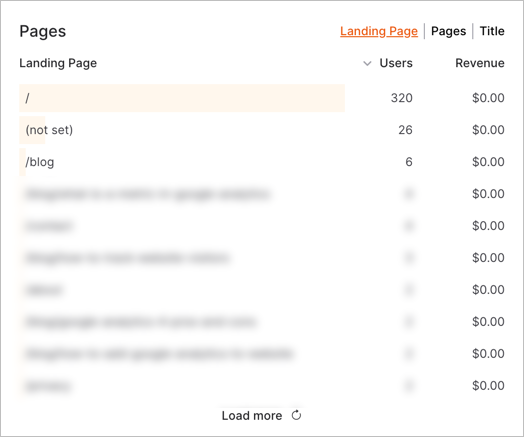
- Which pages are most popular, helping you to optimize your content strategy.
- Which locations and devices people are using, providing valuable insights into your audience.
For example, in the pages report, you might see that your blog posts on a specific topic are attracting a lot of visitors. This means you can create more content around that topic to engage your readers.
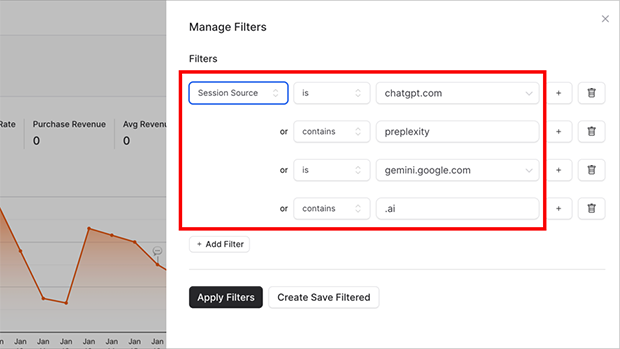
Customizing your reports is just as simple. Unlike the overly complex report builder in GA4, OnePageGA allows you to easily add custom filters, and change which metrics you see on your reports.
Let’s say I want to know which AI engines are sending traffic to my website. In that case, I’d use OnePageGA’s OR logic to filter by specific traffic source like chatgpt.com, google.gemini.com, and so on.
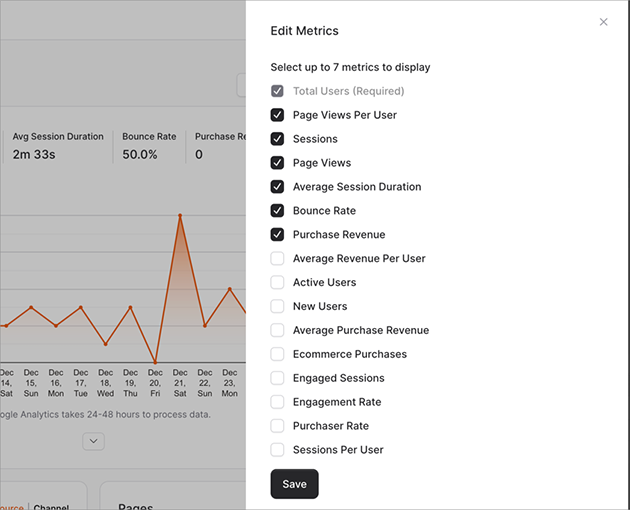
Similarly, you can choose which metrics to track by clicking the settings icon. Here, you can select up to 7 metrics to display that best fit your needs, including:
- eCommerce purchases
- Sessions per user
- Engagement rate
- And much more
With simple Google Analytics reports like these, you can spend less time on learning new platforms, and more on understanding your website data and how it affects your business.
For a head-start, see the types of web analytics you need to know about.
Get Started with Simpler GA Reporting
As you can see from this guide, understanding your website data doesn’t have to be a headache.
With a simpler GA4 dashboard like OnePageGA, you can easily find the information you need, without the unnecessary complexity. You’ll be able to see what is and isn’t working and make smart decisions without feeling overwhelmed.
Start using OnePageGA today and finally feel confident in your analytics
If you have questions or want to join the conversation, you can also find us on X and Facebook.
