Are you wondering if your website is actually working? Do you know who’s visiting and what they’re doing?
Tracking website visitors lets you see what’s performing well and what’s not, giving you the power to make smart decisions that grow your business.
According to a recent report by HubSpot, 61% of marketers say generating traffic and leads is their biggest challenge.
Let’s be real, though, Google Analytics 4 (GA4) can be a lot. It’s powerful, sure, but all that data can be overwhelming and leave you feeling lost.
This guide makes it easier. I’ll show you how to track website visitors with simple, actionable steps you can take right away.
Can I Track Visitors to My Website?
Tracking visitors to your website is possible and easier than you might think. You don’t need to be an expert to understand what’s happening on your site.
The most common method is using a web analytics tool, like Google Analytics. This involves adding a small piece of code to your website, which then collects data about your visitors. You’ll get valuable insights into where people are coming from, what pages they visit, and how long they stay.
Beyond Google Analytics, there are other tools that offer simpler ways to track your visitors. Many focus on specific aspects of website analytics or provide a more user-friendly interface (more on these options later).
Why Track Website Visitors?
So, now you know you can track visitors, but why should you? Simply put, tracking your website visitors allows you to understand how people are interacting with your online presence. As a result, you get insights that can help you improve your website and your overall strategy.
Here’s why it’s so important:
- Understand User Behavior: By tracking visitors, you can see how they navigate through your site. Which pages are they landing on? Where are they clicking? How long are they staying on each page? This data shows how people are actually using your website.
- Improve Website Performance: With this data, you can see what’s working and what’s not. If you notice people are leaving a specific page, it might need attention. You can spot areas for improvement and make your website more user-friendly.
- Enhance Marketing Efforts: You can also see where your visitors are coming from, like social media, search engines, or other sites. This helps you see which marketing channels drive the most traffic and engagement. If a campaign isn’t working, you can adjust your strategy based on real data.
Ultimately, tracking your visitors provides the data you need to make informed decisions. This allows you to improve your website’s design, content, and marketing for a bigger impact on your business goals.
This isn’t just theoretical; a study by McKinsey found that companies that leverage customer behavioral insights outperform peers by 85% in sales growth.
How to Track Website Visitors With Google Analytics
For this guide, I’ll focus on using Google Analytics 4 (GA4), the latest version of Google’s web analytics platform. While there are other options, GA4 is the most popular and widely used method for tracking website data. It’s also completely free.
GA4 helps you get insights into your website’s traffic and user behavior. You can see how people find your site, what pages they visit, how long they stay, and a lot more.
In fact, GA4’s popularity is undeniable. With a staggering 88.7% market share, it’s the go-to analytics solution for most website owners. It’s also used by over 32 million live websites on the internet.
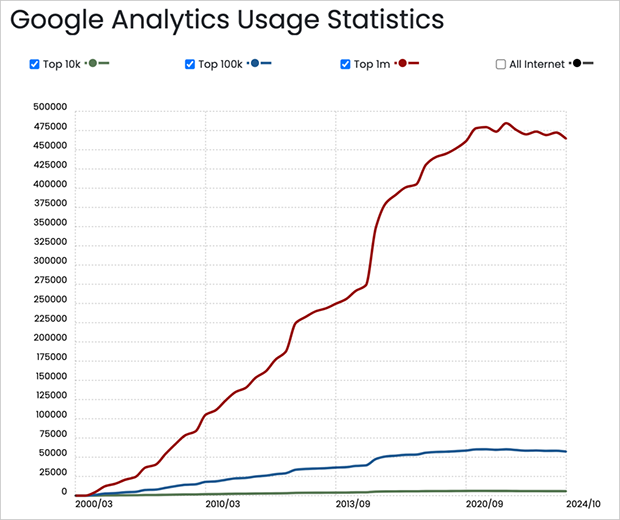
While GA4 is powerful, it’s not without its quirks. To get a more in-depth understanding of its strengths and weaknesses, you can check out my article on the pros and cons of Google Analytics.
Step 1. Set Up a Google Analytics Account and Property
To begin tracking your website with GA4, you’ll need to set up a Google Analytics account and create a property. It’s pretty straightforward.
Start by making sure you have a Google account, then go to the Google Analytics website to sign up. The setup process will guide you through creating a property—this is where your website’s data will be stored.
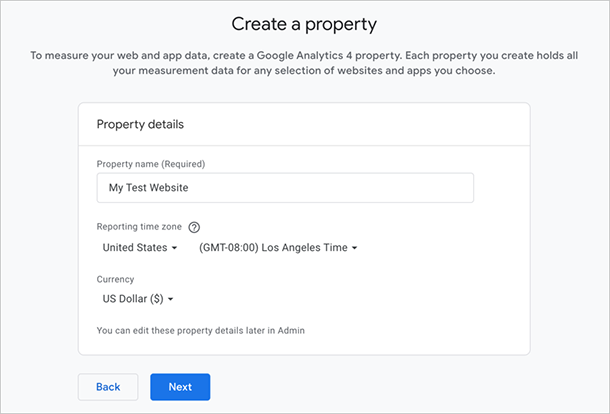
Next, select “web” as your platform and set up a data stream using your website’s URL.
For a more in-depth walkthrough, take a look at my guide on how Google Analytics works.
Step 2. Add the Google Analytics Tracking Code to Your Website
Now it’s time to connect Google Analytics to your website by adding the tracking code. This code is a small snippet of JavaScript the platform uses to collect data about your visitors.
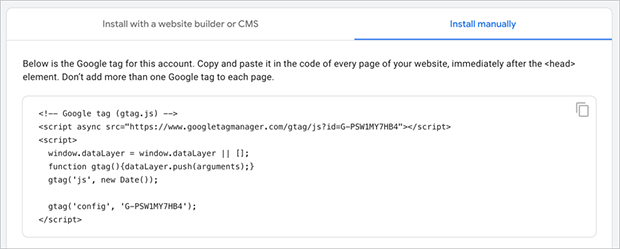
The method for adding this code will vary depending on how your website is built. If you’re using a platform like WordPress, Shopify, or Squarespace, the process is generally straightforward.
Most of these platforms offer a specific place in their settings where you can paste the code. However, if you have a custom-built website, you may need to add the code directly to your site’s HTML.
Don’t worry; no matter what platform you’re using, I have you covered. I’ve put together a detailed guide on how to add Google Analytics to your website, which covers all the major platforms.
Once you’ve added the tracking code, GA4 will start collecting data about your website visitors. This is where things start to get exciting because you’ll be able to see how people are actually using your website.
Step 3. Understand Key Metrics While GA4 Collects Data
Now that you’ve added the tracking code, allow Google Analytics some time to gather data. It might take a few hours or even a day before you see everything, so patience is key here.
While GA4 is collecting information, let’s look at some of the main metrics you’ll be tracking. Understanding these will help you make sense of your data:
- Users: This is the number of unique individuals who visited your site. GA4 uses identifiers to determine new and returning users.
- Sessions: A session is a single visit to your site. It starts when someone arrives and ends after a period of inactivity. If they leave and come back, that’s a new session.
- Pageviews: This is how many times a page on your site has been viewed. If you have an app, it’s the number of screen views. This metric shows which content is most popular.
- Engagement Rate: This is the percentage of sessions where people engaged with your content. It’s based on how long they stay, how many pages they visit, and if they interact with things on the page. A higher rate means your content resonates with your visitors.
- Events & Conversions: Events are specific actions on your site, like clicking a button or watching a video. When these events help your business goals, they’re called conversions.
- Traffic Sources: Acquisition reports show you where your visitors are coming from – search engines, social media, etc. This helps you see what marketing is working.
For a deeper dive into these terms, take a look at my guide on what is a metric in Google Analytics.
Step 4. Analyze Your Website Traffic with Google Analytics
Now that GA4 is set up and collecting data, let’s look at the reports and see what’s happening on your website. Navigating GA4 can be a little tricky, but I’ll show you the important areas.
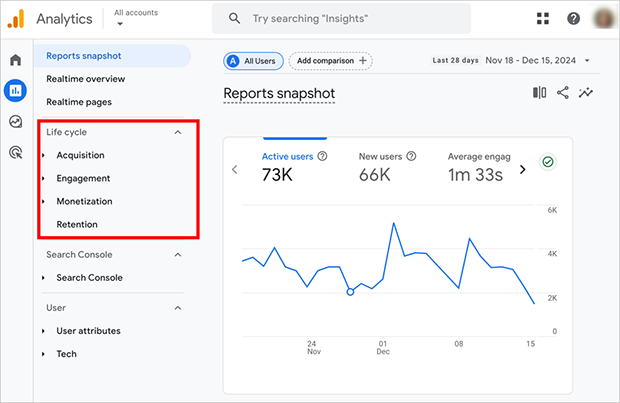
To see your reports, log into Google Analytics. On the left side, click “Reports.”
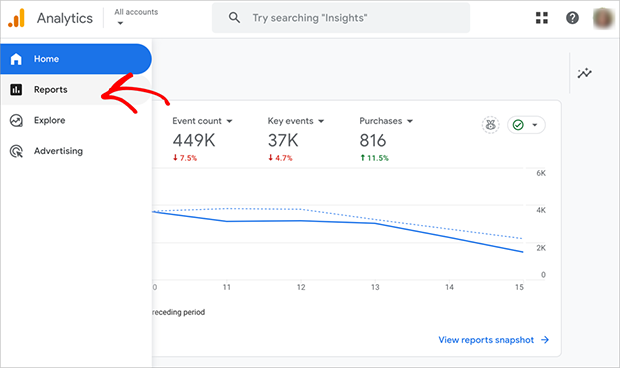
You’ll see categories like “Acquisition,” “Engagement,” and “Monetization.” These reports help you understand how your website is doing.
If you want to create custom reports, GA4 offers “Explorations.”
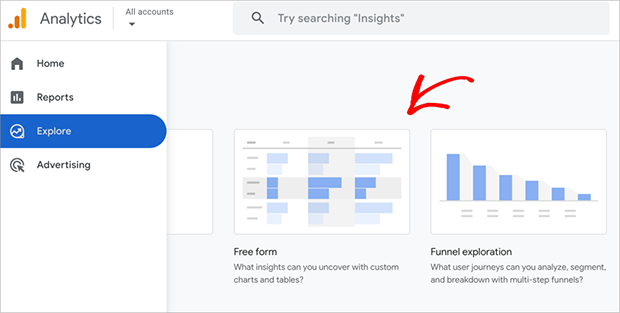
Click “Explore” on the left side and use the drag-and-drop tool to build your own reports.
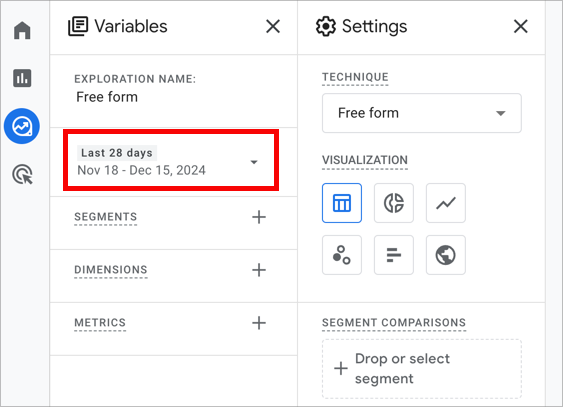
When you analyze your traffic, look for trends. For example:
- Is your social media traffic going up or down?
- Which pages are getting the most attention?
- Are people leaving certain pages quickly?
Based on this data, you can make changes. For example, you might:
- Update content: If a page isn’t getting many views, you could update it or make it more interesting.
- Improve mobile: If lots of mobile users are leaving, you need to make your site more mobile-friendly.
- Change marketing: If a marketing campaign isn’t working, you can adjust it.
The main goal is to use this data to make your website better for your visitors, so you can reach your business goals.
How to Simplify Your GA4 Data
Let’s be honest: GA4 can be complicated. It’s easy to feel lost in all that data, and it can be hard to find the information you need.
Analyzing data in GA4 can also take a lot of time. You often have to make custom reports to find the metrics you want. And even then, understanding the data can be difficult.
That’s why we created OnePageGA. It gives you a simple, easy-to-use view of your GA4 data, without all the confusion.
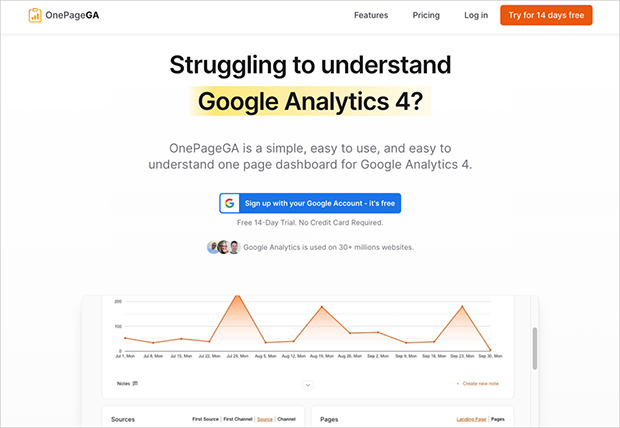
OnePageGA connects to your GA4 account with a few clicks, so you don’t need to add any extra code to your website. It just uses the data GA4 is already collecting.
With OnePageGA you can:
- View important metrics on one easy-to-understand page. You don’t have to click through different reports.
- See those metrics presented in a way that’s easy to understand and use to improve your business.
- Discover insights much faster so you can focus on other areas of your business.
- Get started quickly, even if you’ve never used GA4 before.
Setting up OnePageGA is also easy. Just connect your GA4 account, and OnePageGA will show your data on a single page.
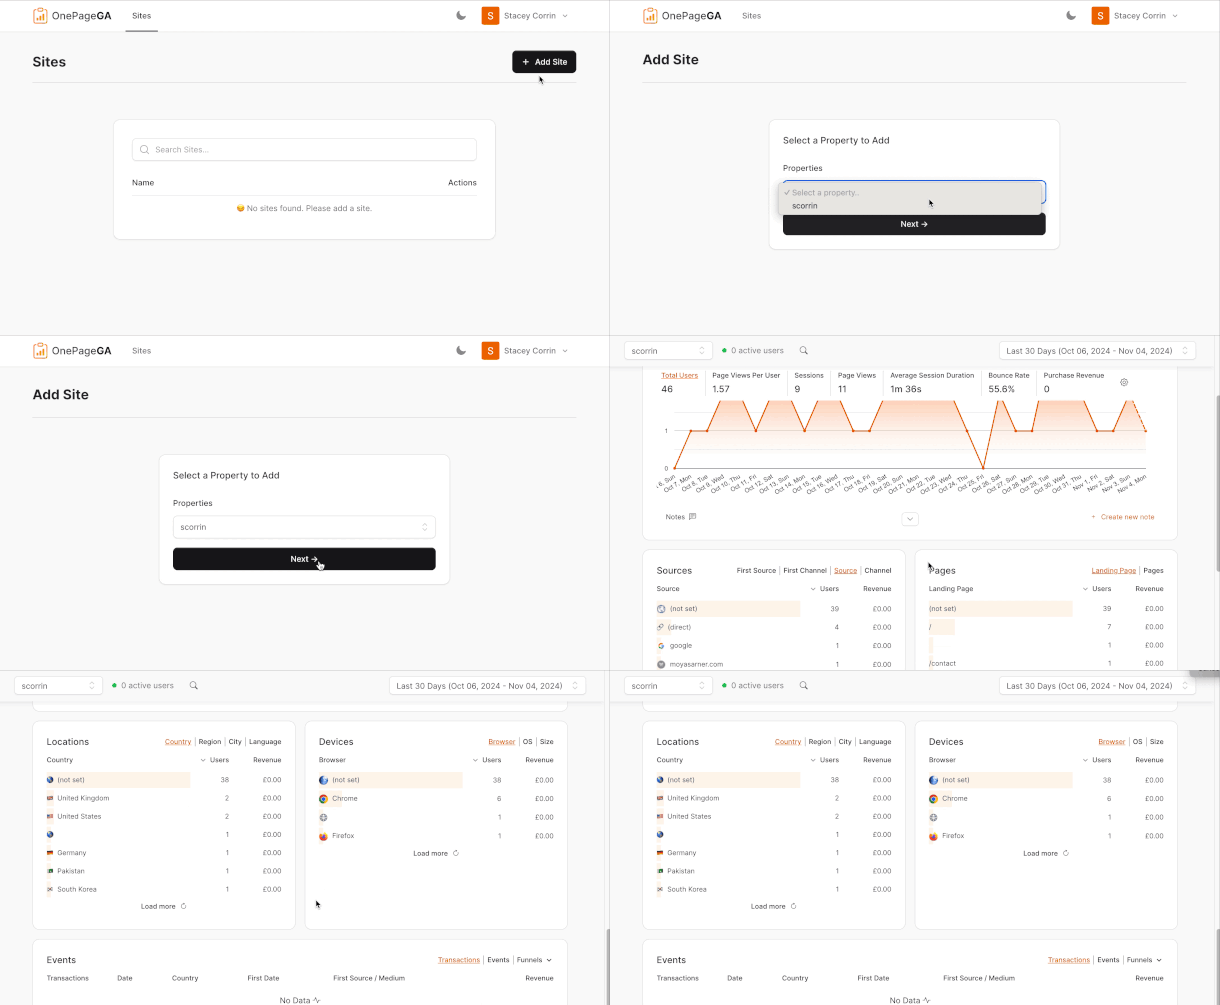
How to Track Website Visitors in OnePageGA
When you open your OnePageGA dashboard, you’ll see a graph of your site’s performance. This includes page views, sessions, how long people stay, and your bounce rate.
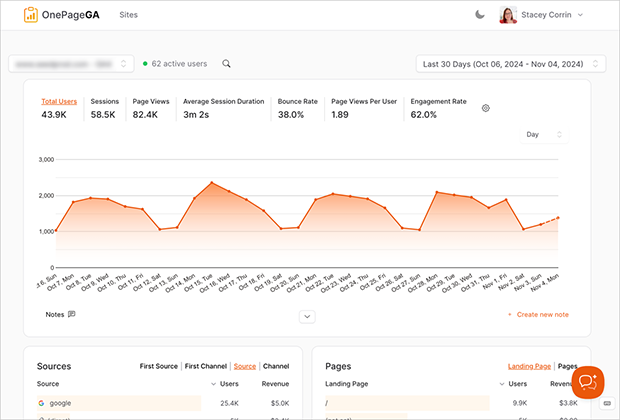
All of this is in one simple view, so you can quickly understand what is and isn’t working.
Below the graph, you’ll find simple Google Analytics reports for:
- Where your traffic comes from.
- Which pages are most popular.
- Which locations and devices people are using
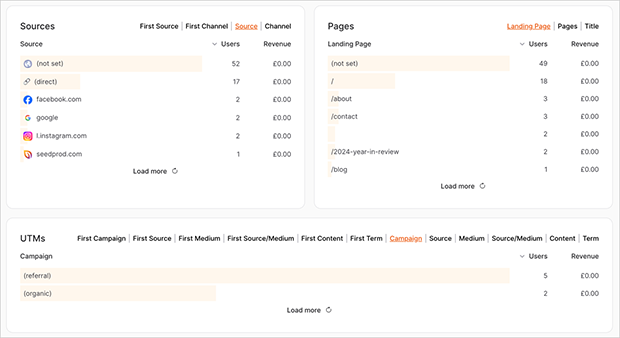
It’s designed to give you the information that matters, right when you need it. And if you need more details, you can easily drill down and filter by different data points.
Want to see how your website performs over time? Just click ‘Compare’ in the date picker, and you can see a visual comparison.
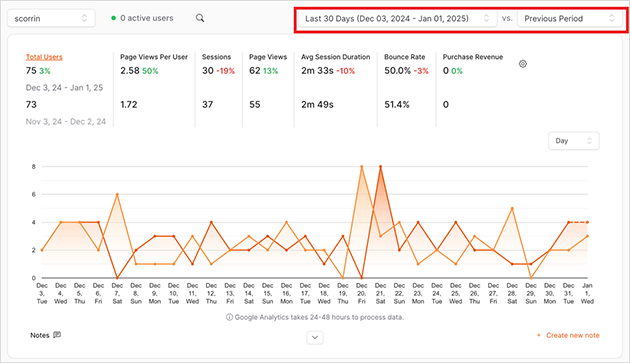
OnePageGA also lets you design your own custom reports.
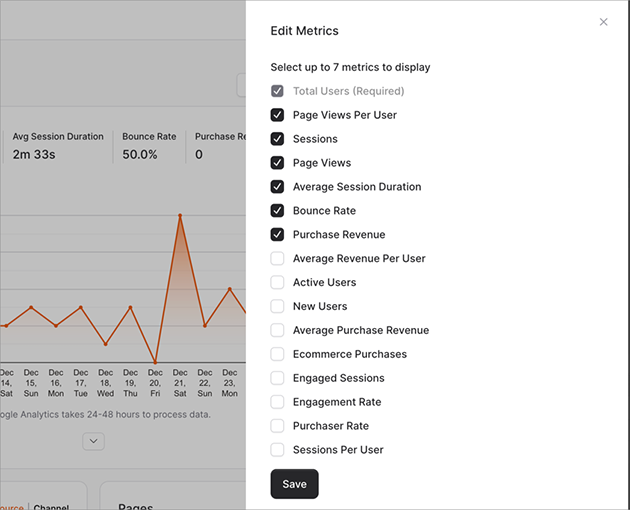
You can choose which metrics to track, including:
- New users.
- How engaged your users are.
- How much revenue you’re making.
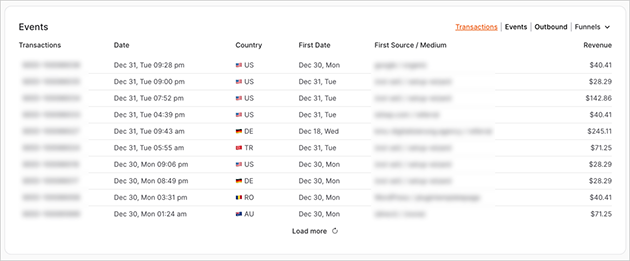
If you run an online store, it’s just as easy to track your eCommerce data, including revenue and transactions.
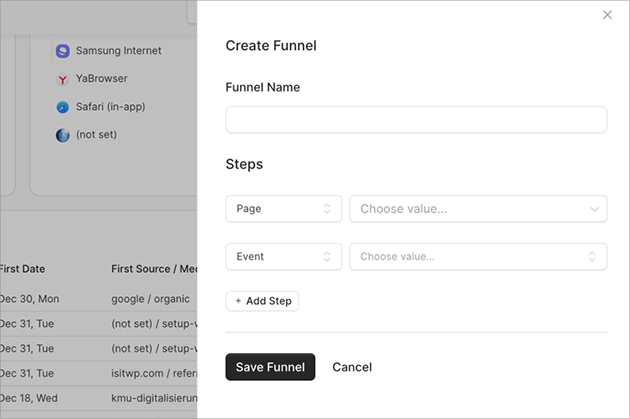
You can also set up custom sales funnels to track visitors from when they land on your site until they become subscribers or customers.
Besides this, OnePageGA also lets you:
- Track multiple websites from one dashboard.
- Add notes to your reports to see how specific actions affect your traffic.
- Track unlimited pageviews without extra fees.
- Toggle on dark mode to browse comfortably at night.
With OnePageGA, you can easily see your website’s performance, quickly find areas to improve, and make informed decisions to grow your business.
Turn Visitor Data into Real Results
Ultimately, learning how to track website visitors is the best way to understand how they use your site, so you can improve it. GA4 is great for collecting the data, but it’s complex. That’s where OnePageGA shines. It takes your GA4 data and puts it on one simple page, so you can understand what’s happening without the headache.
Think of it this way: GA4 gives you the raw numbers, and OnePageGA helps you quickly make sense of them. Using both is the most effective approach.
Ready to make things easier? Start a 14-day free trial of OnePageGA today and see your website data in a whole new way.
If you have questions or want to join the conversation, you can also find us on X and Facebook.

