A session in Google Analytics is a specific period of time when a user is actively interacting with your website or app. Think of it as a single “visit” where someone clicks, scrolls, or views pages before leaving or taking a long break.
If you’re coming from the old Universal Analytics (UA), you’ve probably noticed that session numbers in Google Analytics 4 (GA4) look a bit different. That’s because GA4 has a new way of counting these visits, and the change is throwing a lot of site owners off.
Don’t worry, though. I’m going to break down exactly how sessions work now, why the numbers changed, and which metrics actually matter for your business growth.
What Does a Session Mean in Google Analytics?
In simple terms, a session is a period of time when a user is active on your website.
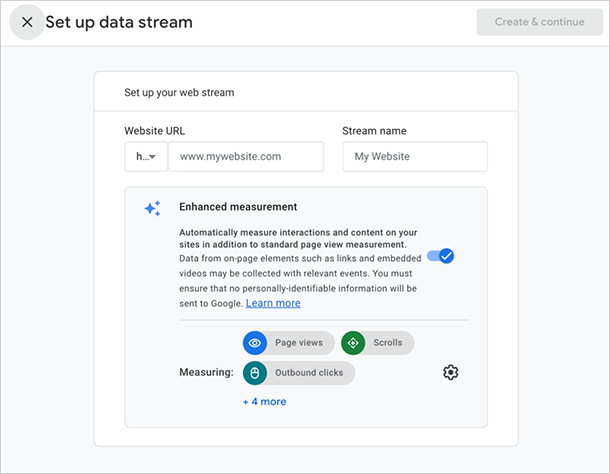
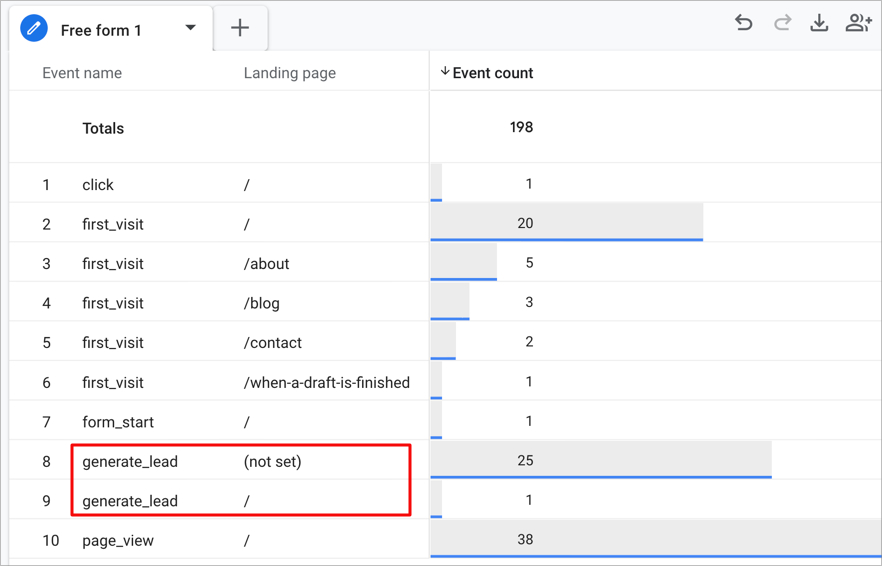
Behind the scenes, GA4 tracks this using the session_start event. When a visitor lands on your page, GA4 checks if they have an active session ID. If they don’t, it fires the session_start event to begin a new one.
This distinction matters because session data shows you the volume of interaction on your site, not just how many individual people stopped by. But to read the numbers right, you need to know exactly when the timer starts and stops.
How GA4 Starts and Ends a Session
GA4 kicks off a session the instant a visitor arrives on your site and triggers that session_start event.
The system keeps the session alive as long as the user is doing something. However, if they stop interacting with your page for 30 minutes, GA4 closes the books on that specific session. If they come back and click something after that break, a brand new session begins.
Here’s a simple example: If someone visits your site at 2:00 PM, leaves the tab open while they eat lunch, and comes back to click a link at 3:00 PM, GA4 counts that as two sessions.
There are a few other specific rules regarding session restarts:
- Midnight Reset: Unlike the old Universal Analytics, GA4 does not restart a session at midnight. If a user is active from 11:55 PM to 12:05 AM, it remains a single session.
- Campaign Parameters: While GA4 is smarter about this than the old version, clicking a link with new UTM parameters (like a different ad campaign) can trigger a new session if the previous one had timed out.
Because GA4 relies on an event-based model, it’s strictly looking for those interaction events to keep the timer running. This is a shift from the old hit-based tracking, and it creates the biggest confusion when comparing data to the old Universal Analytics.
For more details about events, see our guide: What Are GA4 Events and Why Should You Care?
How GA4 Sessions Compare to Universal Analytics
The main reason your numbers look different is how GA4 handles traffic sources for active users.
In the old Universal Analytics (UA), if a visitor clicked a new ad campaign link while they were already browsing your site, UA would cut the current session short and force a new one to start immediately.
GA4 is smarter. As long as the user hasn’t timed out (hit that 30-minute mark), GA4 ignores the change in campaign source and keeps the single session running.
Also, GA4 replaced the old logic of ‘Bounce Rate’ with ‘Engagement Rate.’ In UA, a session with no interaction was a bounce. In GA4, a session is considered ‘engaged’ if it lasts 10 seconds or more, includes a conversion, or visits at least two pages.
Here is the quick comparison:
| Feature | Universal Analytics (UA) | Google Analytics 4 (GA4) |
|---|---|---|
| Tracking Method | Hit-based (Pageviews) | Event-based (User interactions) |
| Active Campaign Changes | Starts a new session | Continues current session |
| Bounce Rate | Single-page sessions = Bounce | Replaced by Engagement Rate |
| Late Hits | Processed next day | Processed when they happen |
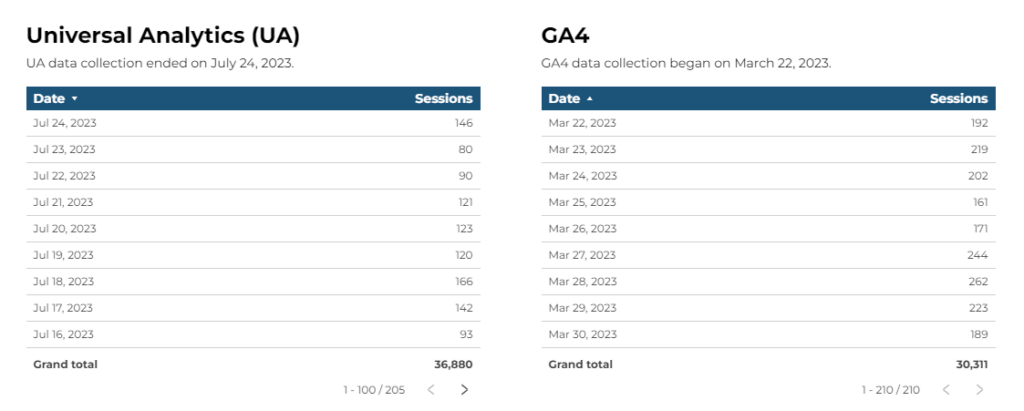
I’ve noticed that for most sites, session counts in GA4 are slightly lower than they were in UA. That’s usually because GA4 keeps a single session alive, rather than fracturing it into multiple visits just because a campaign parameter changed mid-stream.
The Key Session Metrics You’ll See in GA4
When you open your reports, you’re going to see several metrics that sound similar but measure very different things. Here is your cheat sheet for what Google Analyics metrics actually mean:
| Metric | Definition |
|---|---|
| session_start | The raw event GA4 fires the moment a new session begins. |
| Sessions | The total number of visits to your site. |
| Engaged sessions | The “quality” metric. A session counts as engaged if it lasts 10+ seconds, has 2+ page views, or includes a conversion. |
| Engagement rate | The percentage of your total sessions that qualified as “engaged.” |
| Avg. engagement time | Replaces “average session duration.” It tracks the actual time the page was in the foreground of the user’s browser. |
| Views per session | A measure of how much a user explored your site during a single visit. |
| Sessions per user | A quick indicator of loyalty. If this number is high, people are coming back. |
You should look at these metrics as a story about your user experience. For instance, a high engagement rate means visitors are actually reading what you write.
However, if you see low “views per session,” it usually means your site is hard to navigate. If you are using WordPress, a builder like SeedProd can solve this quickly; it lets you redesign your headers and navigation menus with a drag-and-drop interface, making it easier for visitors to find more content and stay longer.
Where to Find Session Data in GA4
Now that you know what a session is, let’s find the actual numbers in your dashboard.
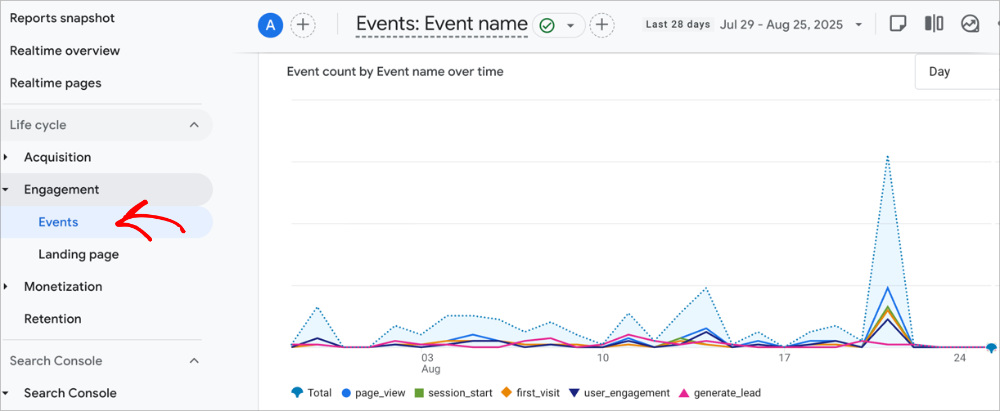
- Log in to your Google Analytics 4 account.
- On the left menu, click Reports.
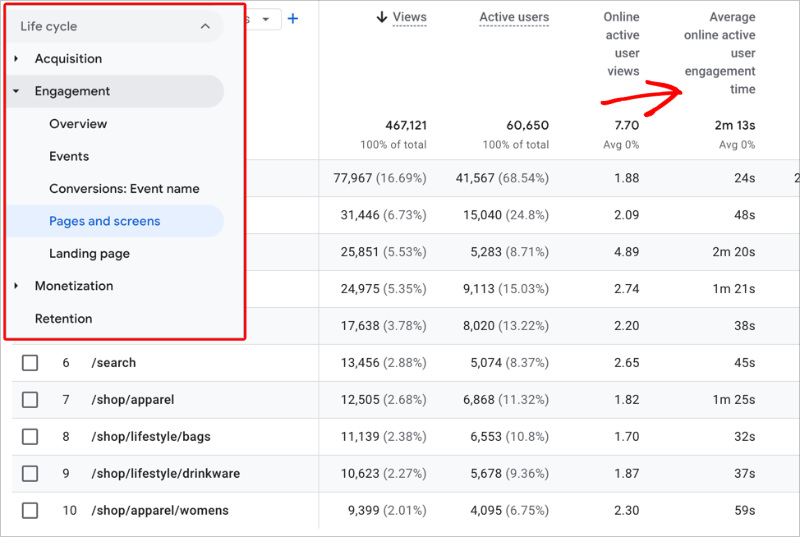
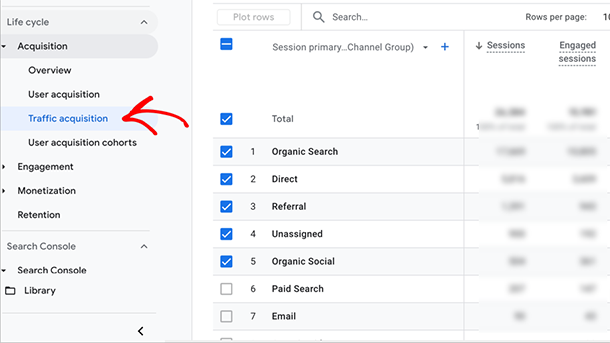
- Expand the Acquisition menu and select Traffic acquisition.
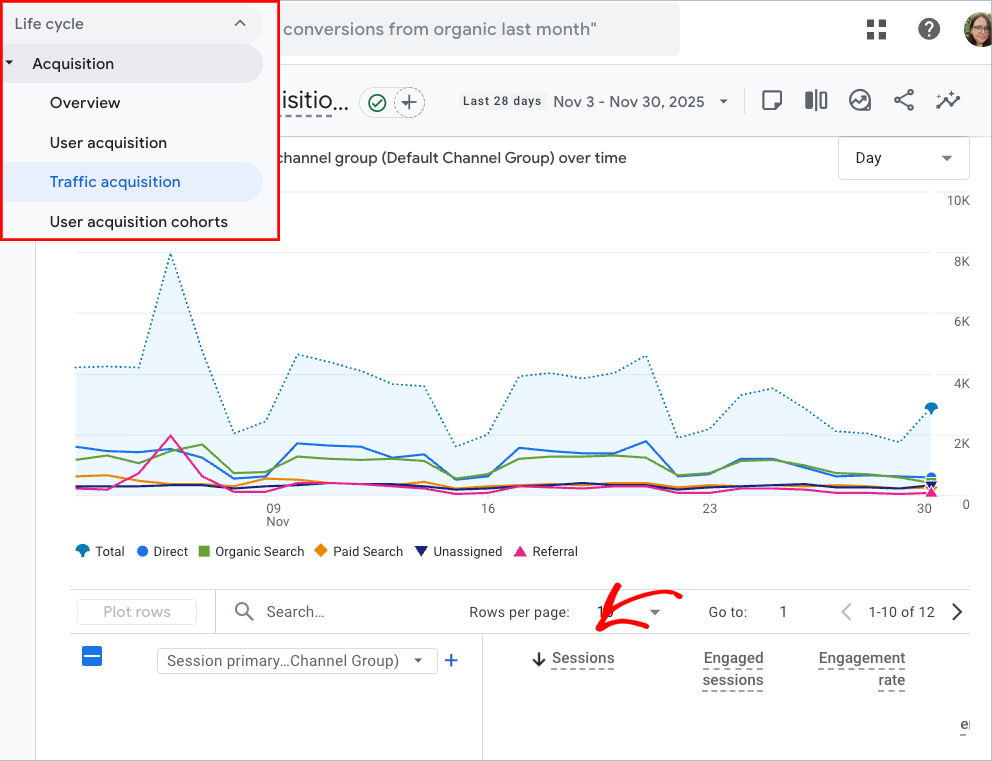
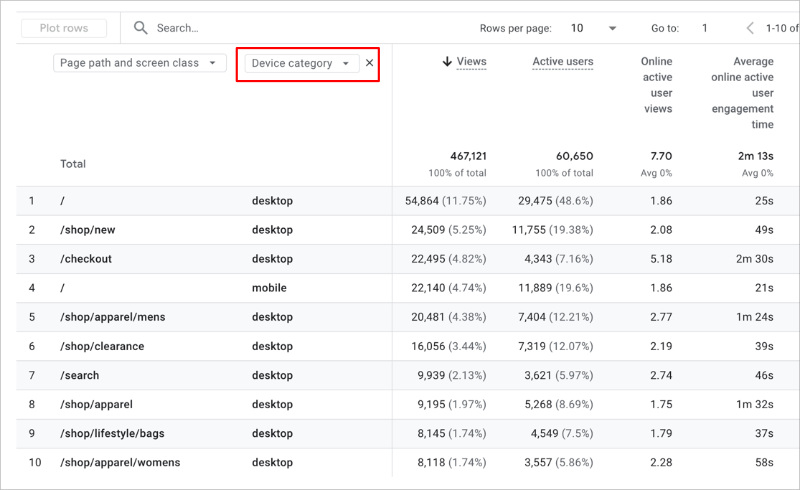
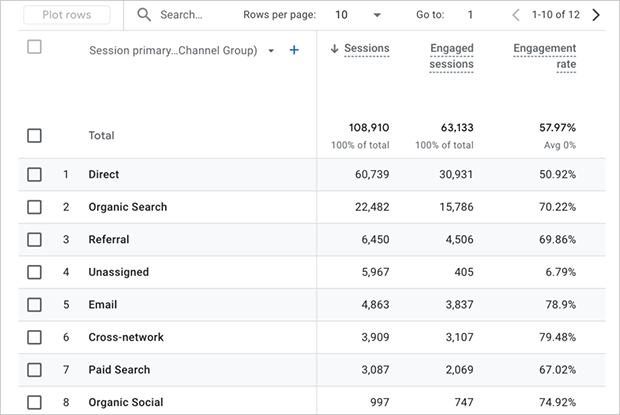
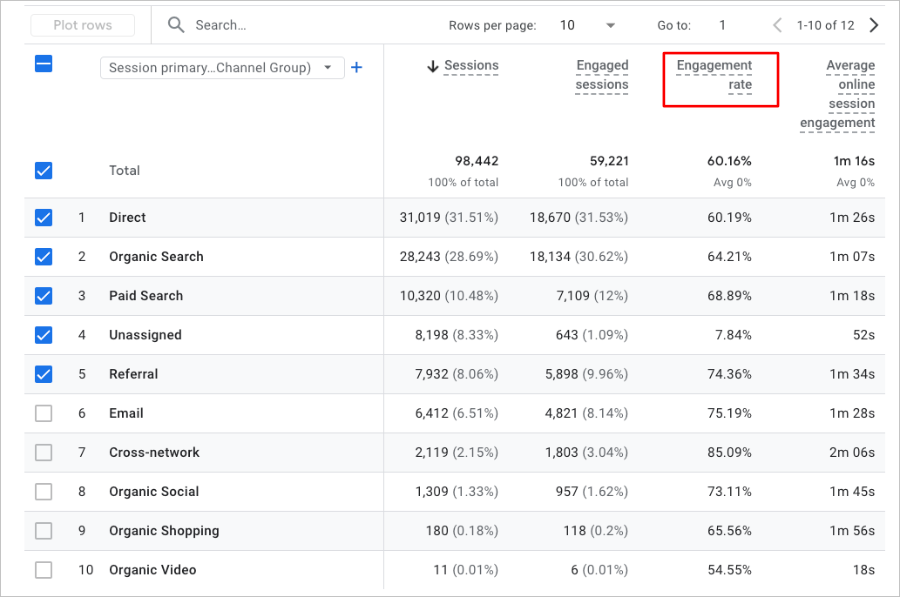
The Traffic acquisition report is your home base. By default, you’ll see the Sessions column sitting right next to Engaged sessions.
This report is essential because it breaks down exactly where your visits are coming from, whether it’s Google Search, your email newsletter, or social media.
Where Is the Rest of GA4 Session Data?
Depending on your screen size, you might have to scroll to the right of the table to find Engagement rate or other key metrics. If you don’t see them, don’t panic. GA4 sometimes hides these columns, or you may need to click the pencil icon to add them to your view.
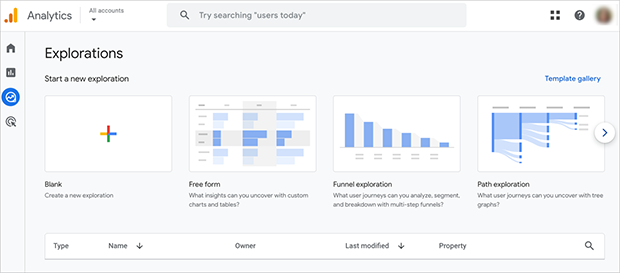
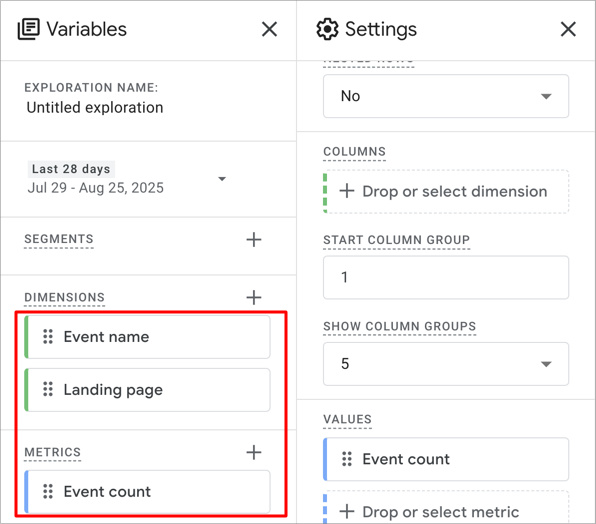
Do I Need to Use the “Explore” Tab in GA4?
You’ll see a lot of experts recommending the Explore section to build custom session reports. Honestly? Unless you are a data analyst, you can skip that for now.
As of 2025, the standard Traffic acquisition report covers 90% of what you need without the headache.
How to Make Google Analytics Session Reporting Easier
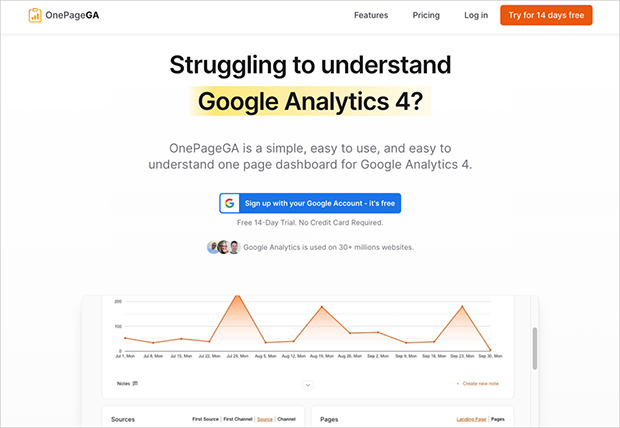
If digging through those GA4 menus feels like a chore, you’re not alone. Most site owners just want to know if their traffic is going up or down without clicking five different buttons every morning.
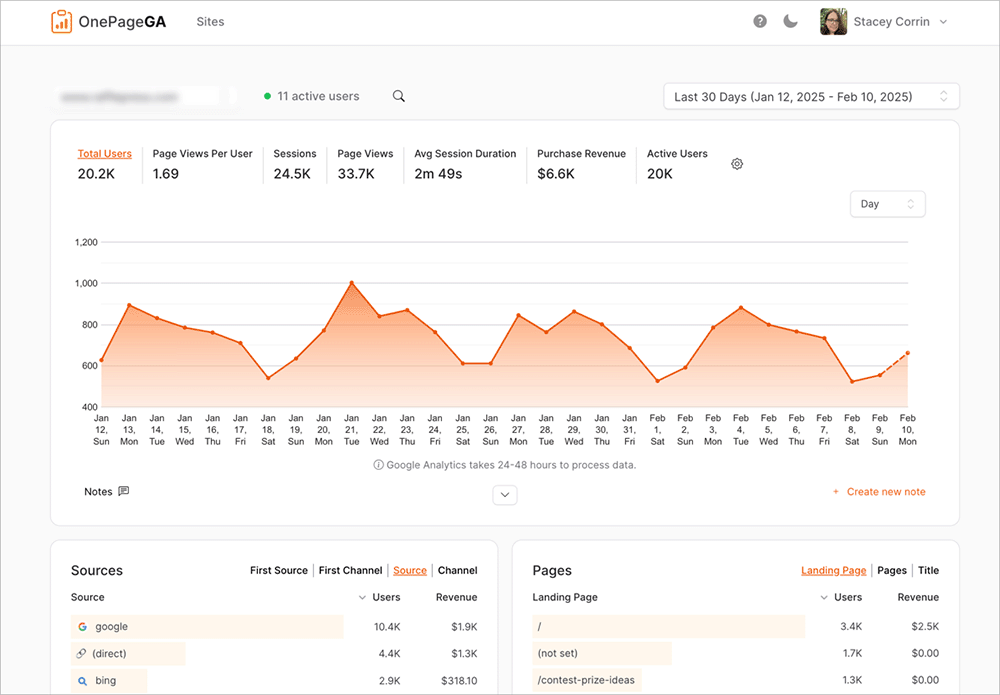
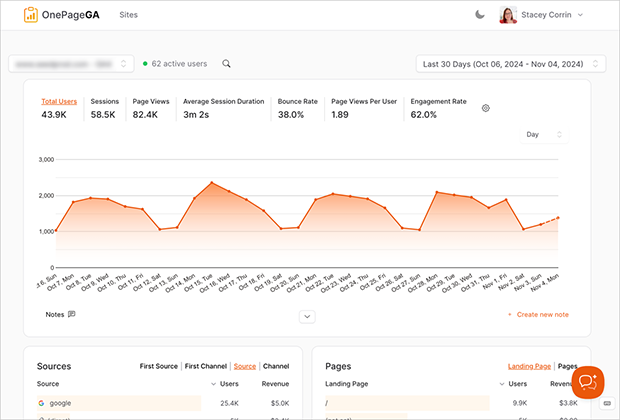
That’s exactly why we built OnePageGA. It’s a streamlined, Google Analytics dashboard that pulls your essential metrics into a clean, easy-to-read single-page report.
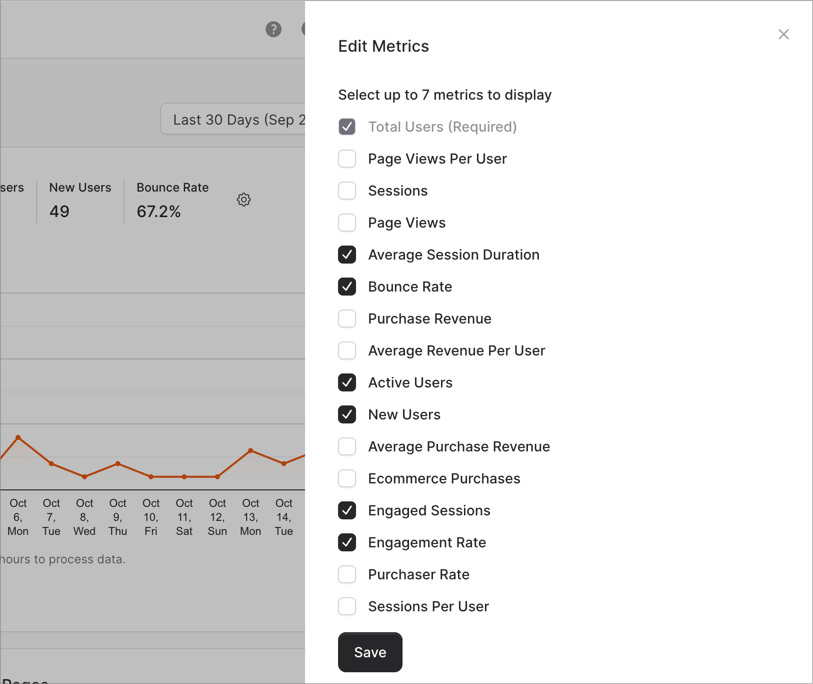
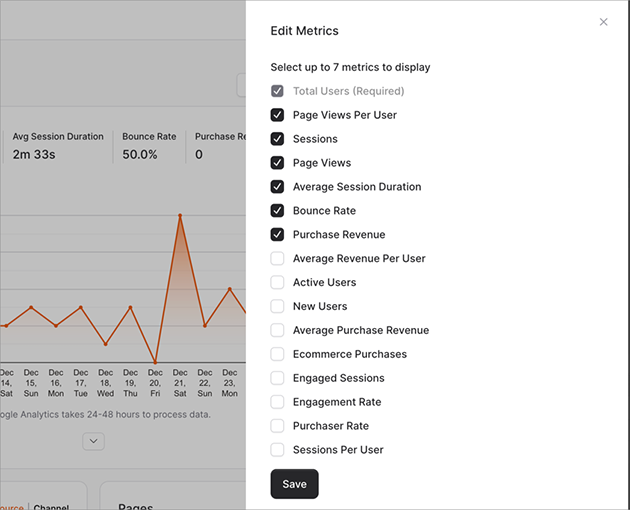
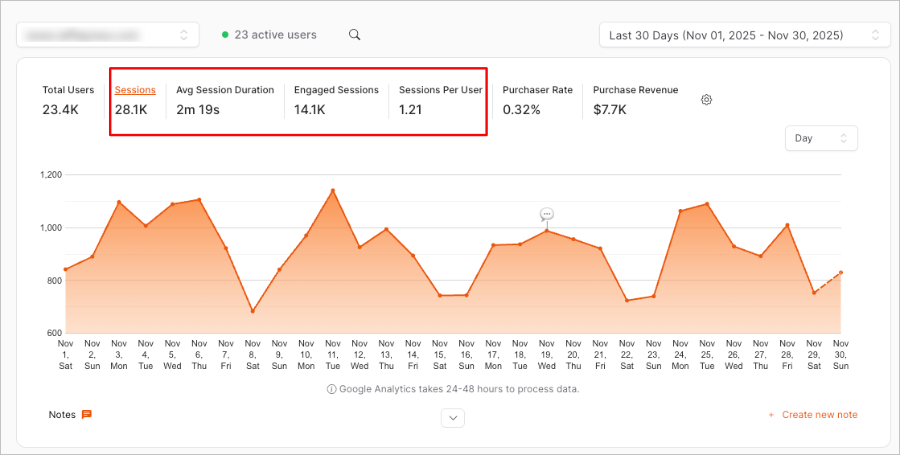
Instead of being stuck with a rigid template, you can make the report your own. Just click the Edit Metrics toggle and select up to 7 metrics that fit your goals.
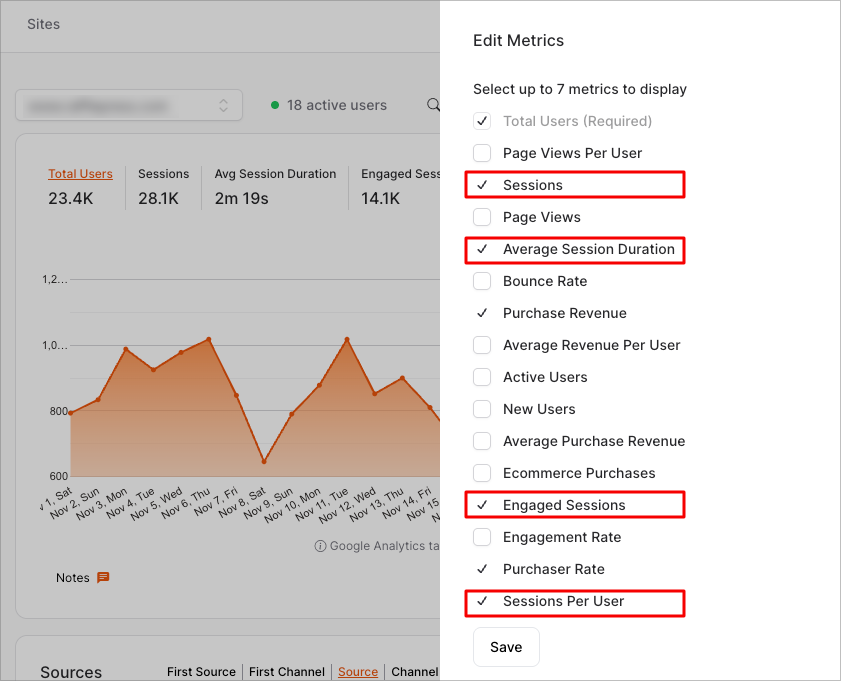
For a clear picture of your session quality, you can choose:
- Sessions
- Average session duration
- Engaged sessions
- Sessions per user
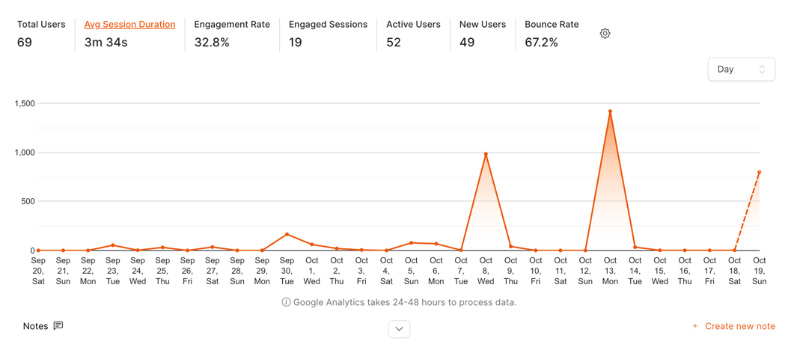
You’ll then see that data at the very top of your analytics report, where you can filter by date range.
Get a Complete View of Your Website Data
Sessions are just the starting point. To really grow your site, you need to know who those visitors are and what they’re doing.
OnePageGA allows you to expand your dashboard to see the full picture. Beyond session metrics, you can track:
| Metric | What It Tells You |
|---|---|
| Top Pages | Finds out which articles or products are grabbing the most attention. |
| Traffic Sources & UTMs | Shows exactly which marketing campaigns are working. |
| Locations & Devices | Reveals where your audience is located and how they browse. |
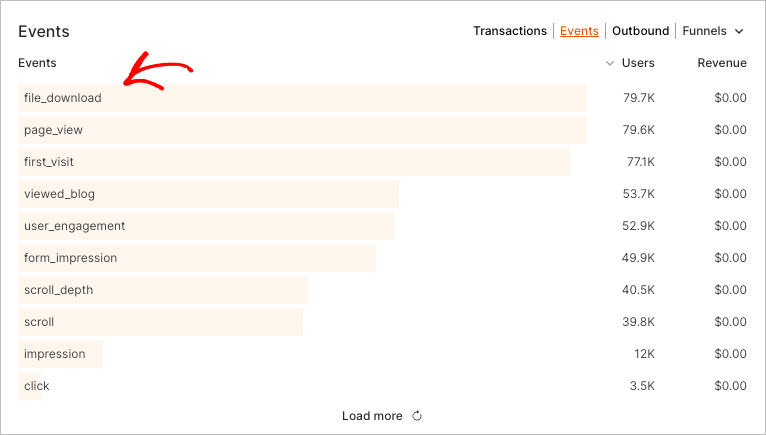
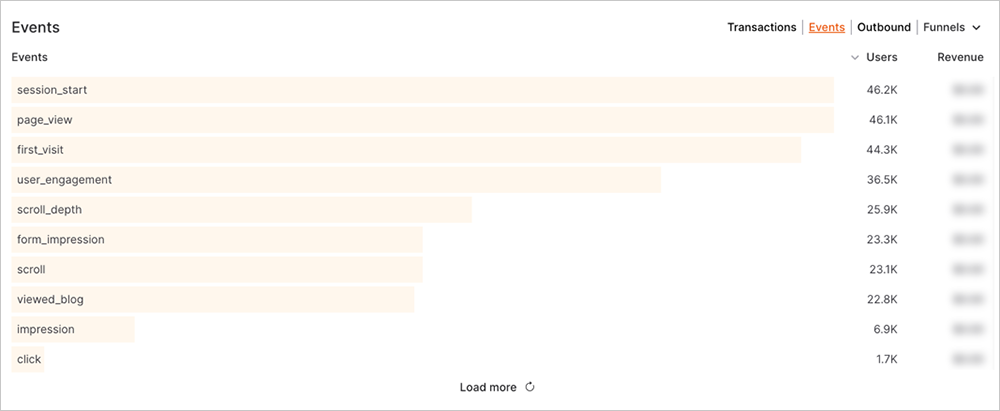
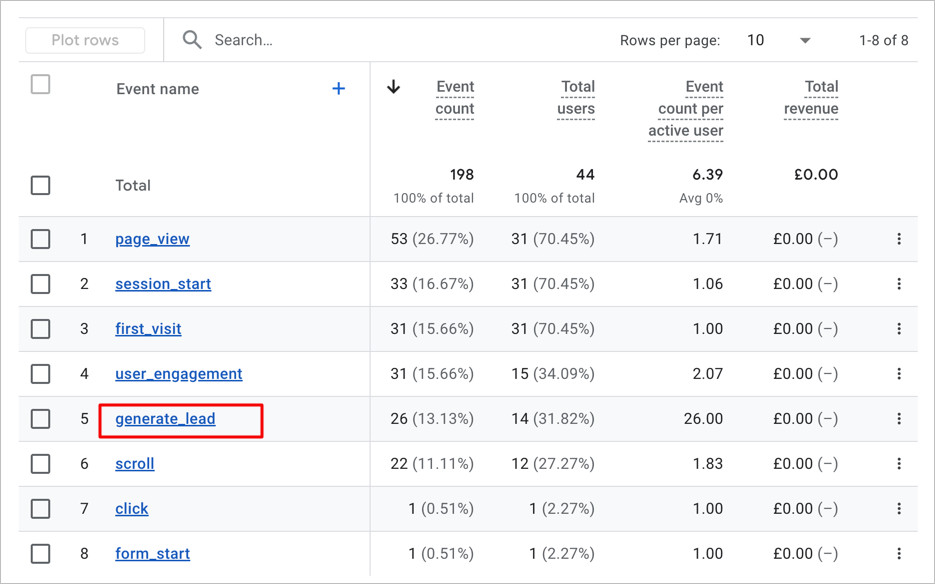
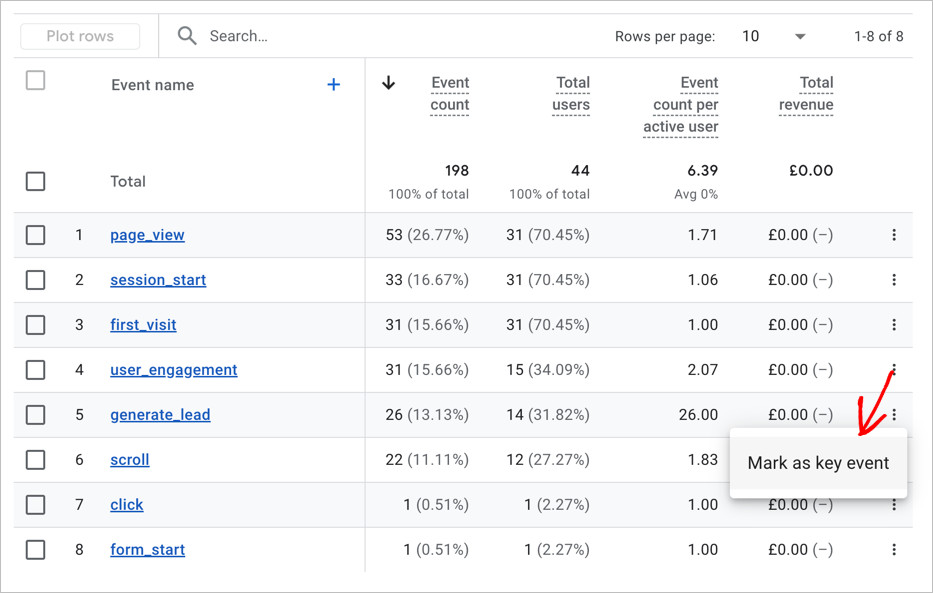
| Events | Tracks specific clicks, downloads, and other key interactions. |
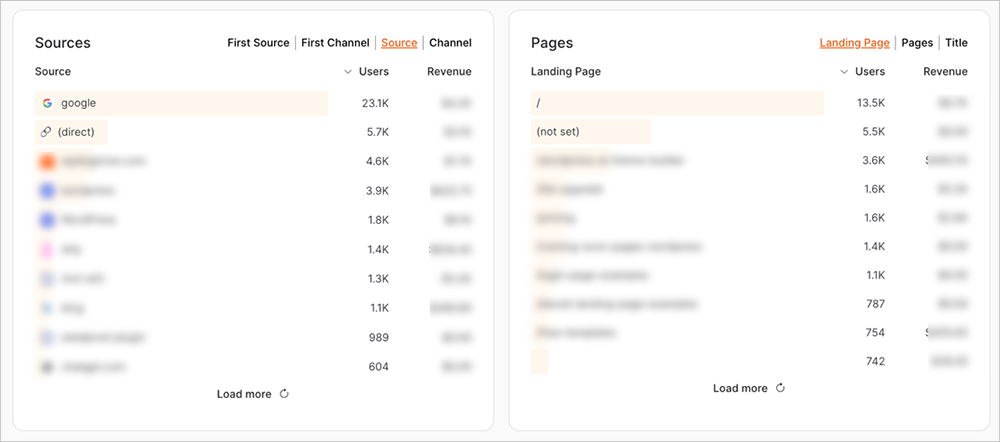
This is the fastest way to keep an eye on your site’s health. You get the power of GA4’s data with the simplicity you actually need.
FAQs About Sessions in Google Analytics
What’s the difference between sessions and users in Google Analytics?
A user represents an individual person (or browser) who visits your site. A session is the visit itself. One user can have multiple sessions. For example, if I visit your site today, leave, and come back tomorrow, GA4 counts that as 1 User and 2 Sessions.
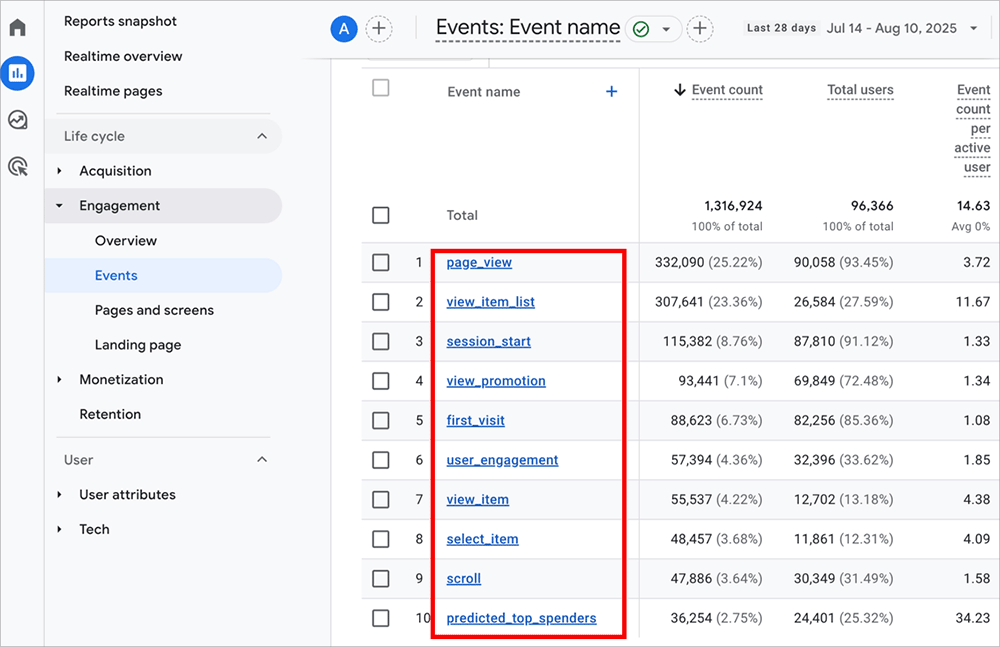
What’s the difference between sessions and events in Google Analytics?
Sessions are the container for all activity, while events are the specific actions within that container. Page views, clicks, and scrolls are all “events” that happen inside a “session.”
How long does a session last in Google Analytics?
By default, a session lasts until the user has been inactive for 30 minutes. You can adjust this timer in your GA4 settings if you run a site where users might read or watch content for longer periods without clicking anything.
Are sessions and visits the same in Google Analytics?
Yes, practically speaking. “Visits” was the terminology used in much older analytics tools. Google Analytics uses the term “Sessions,” but they describe the exact same concept: a period of activity on your site.
What is a good average session duration in Google Analytics?
This varies wildly by industry, but generally, a session duration between 2 to 3 minutes is considered healthy. If yours is under 1 minute, you might need to improve your content or navigation to keep people interested.
Final Thoughts
Understanding sessions is the first step to mastering Google Analytics 4. Once you know that a session is just a container for user activity, the rest of the reports start to make a lot more sense.
Remember, while GA4’s default reports are powerful, they can be overwhelming. If you want a cleaner, faster way to track your sessions and growth, OnePageGA is the tool to use. It strips away the noise and gives you the exact data you need to grow your business.
Ready to simplify your analytics? Get started with OnePageGA today.
You may also find the following guides helpful:
- How to Measure Time on Page in Google Analytics
- What Is a Conversion in Google Analytics
- How to Track Form Submissions in Google Analytics
- What Is a User in Google Analytics?
- How to Add Annotations in Google Analytics 4
If you have questions or want to join the conversation, you can also find us on X and Facebook.