Stacey has been writing about SaaS and digital marketing for over 10 years and on other topics for much longer. Alongside this, she's fascinated with web design, user experience, SEO, and scaling small businesses.
Engagement Rate vs. Bounce Rate in GA4: What’s the Difference?
Posted on - Written By:
Stacey Corrin
Contents
I used to rely on bounce rate all the time in Universal Analytics. It was how I spotted underperforming pages quickly. Then GA4 came along and changed the rules.
Bounce rate got replaced by engagement rate, which tracks meaningful sessions, like someone spending time on your site or clicking around. At first, I wasn’t sure what counted or when I should still check bounce rate.
If you’ve wondered the same thing, this guide clears it up. I’ll explain how both metrics work in GA4, how they’ve changed, and when to use each one.
What Is Engagement Rate in Google Analytics 4?
Engagement rate tells you how many sessions actually mattered. Not just visits, but sessions where someone stuck around or interacted with your site.
In GA4, a session is a visit to your website that includes all the activity from one user during a short period of time. By default, GA4 ends a session after 30 minutes of inactivity, so if someone comes back later, it counts as a new one.
A session is counted as engaged if the user:
Stayed on your site for 10 seconds or longer
Viewed two or more pages or screens
Triggered a conversion event (like a form submit or a purchase)
So if someone scrolls, clicks, or completes an action, GA4 sees that as real engagement. If they land and leave without doing anything, it doesn’t count.
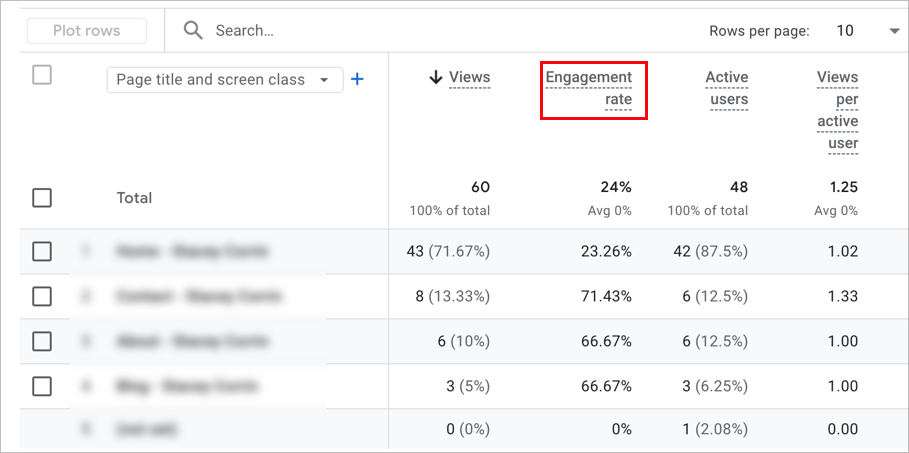
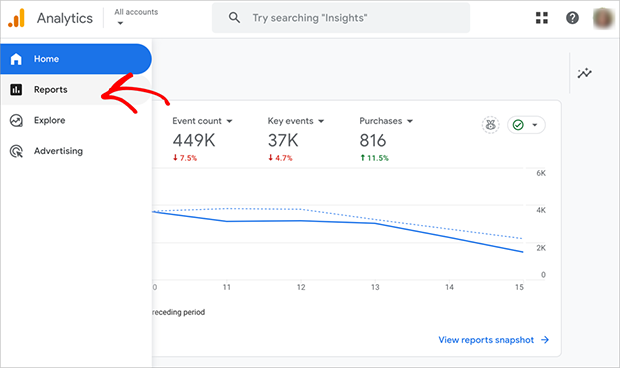
You’ll find engagement rate under Reports » Engagement » Overview.
Engagement rate in GA4 shows up under Reports » Engagement » Overview
It shows up as a percentage, along with metrics like engaged sessions and average engagement time.
Key Takeaway: Engagement rate shows how many sessions involved real interaction, not just a visit.
What Is Bounce Rate in GA4? (And How It’s Different Now)
Bounce rate used to mean one thing: someone landed on your site and left without clicking or doing anything else. In Universal Analytics, that counted as a bounce.
In GA4, the definition changed.
Now, bounce rate is thepercentage of sessions that had no engagement. That means the user didn’t stay for at least 10 seconds, didn’t view a second page, and didn’t trigger a conversion event.
Basically, bounce rate is the opposite of engagement rate. GA4 calculates it like this:
Bounce rate = 100% minus engagement rate
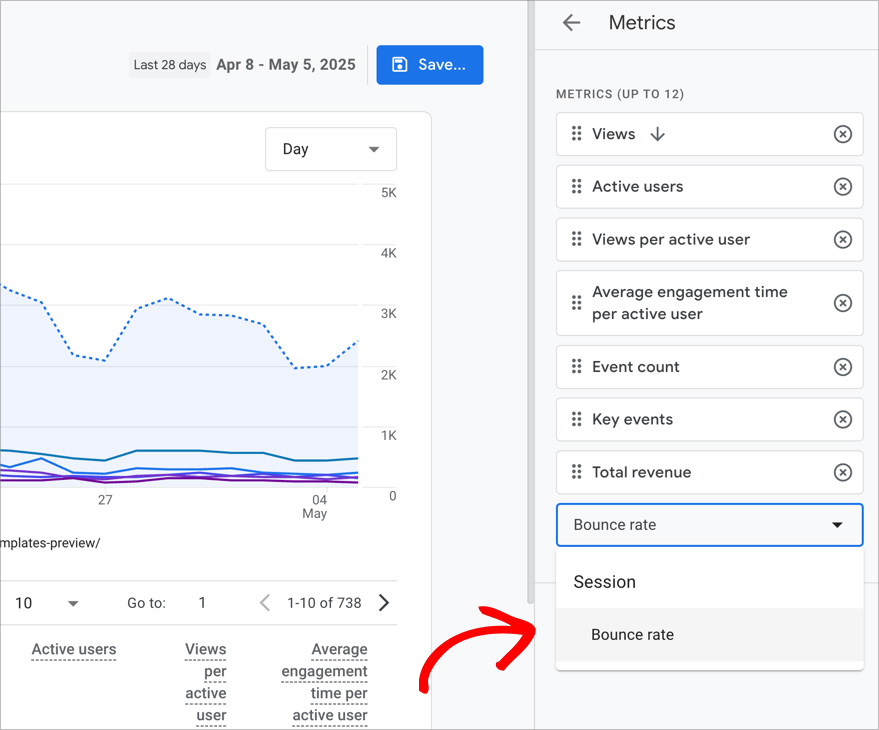
You won’t see bounce rate in GA4 reports by default. To add it:
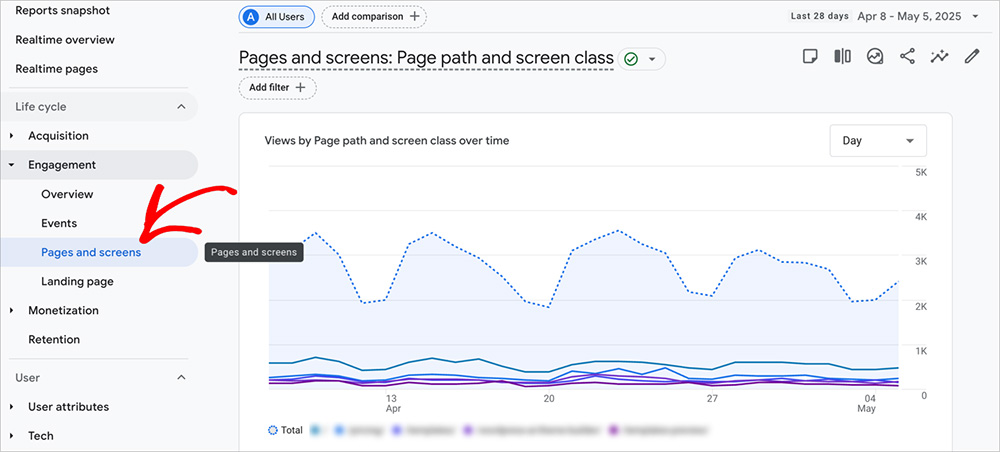
Go to Reports » Engagement » Pages and Screens, click the pencil icon to edit the report, then add “Bounce rate” as a metric.
You need to manually add bounce rate to your Pages and Screens report in GA4
Key Takeaway: In GA4, bounce rate shows sessions without engagement. It’s a reversal of engagement rate and is harder to interpret by itself.
Engagement Rate vs Bounce Rate: What’s the Real Difference?
Engagement rate and bounce rate are tied together in GA4, but they tell you very different things.
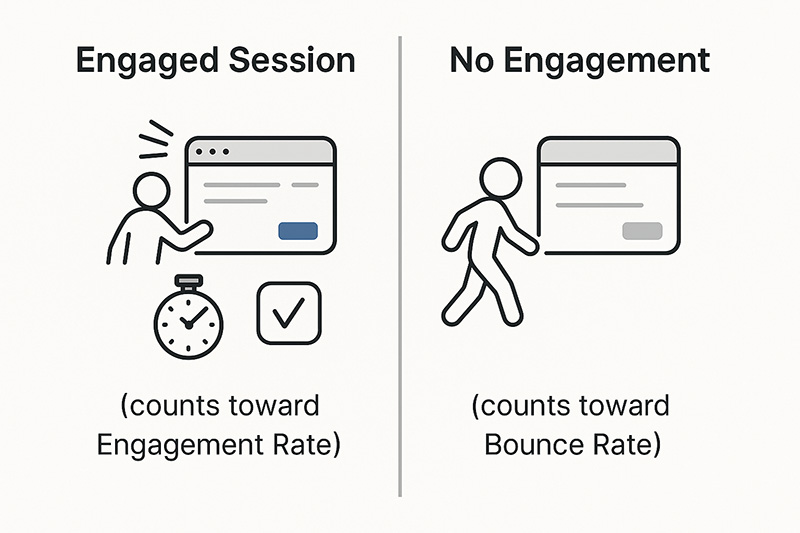
Engagement rate shows what users did. Bounce rate shows what they didn’t do.
One focuses on positive behavior. The other flags a lack of activity.
An engaged session includes time, clicks, or conversions. No interaction counts as a bounce in GA4.
Here’s a quick comparison:
Metric
GA4 Definition
What It Shows
Engagement Rate
Sessions with 10s+, conversion, or 2+ screens
Active interest
Bounce Rate
Sessions with no engagement
Passive or disinterested traffic
Both metrics come from the same set of data, but engagement rate gives you more to work with. You can track what’s working, what content holds attention, and where users actually interact.
When Should You Use Engagement Rate?
If you want to know what’s working on your site, engagement rate is the metric to watch.
I use it when I’m testing landing pages, updating blog content, or checking traffic from paid campaigns. It tells me if people are actually interacting instead of loading the page and leaving.
It’s especially helpful for:
Landing pages
Blog posts
Paid ads with UTM links
Email campaigns
Mobile vs desktop comparisons
For most blogs and landing pages, I aim for 60 percent or higher. If I see a drop below 40 percent, I take a closer look to see what’s not working.
You can segment by traffic source, page, or device in GA4. I like pairing this with the top converting traffic sources in GA4 to figure out which ones bring visitors who actually stick around.
I also usually check OnePageGA instead because it shows engagement rate alongside everything else in one view.
When Should You Look at Bounce Rate?
Even though bounce rate isn’t as useful as it used to be, I still check it when something feels off.
A high bounce rate can point to:
Broken or slow-loading pages
Bad-fit traffic from ads or social posts
Misleading meta titles or descriptions
Content that doesn’t match search intent
But it’s not always a problem. Some pages are meant to be quick. That includes a contact page, a thank-you page, or a single-page guide. In those cases, a high bounce rate might be completely fine.
If bounce rate is high and engagement rate is low, that’s when I dig in and look closer.
How to Track Engagement Rate and Bounce Rate the Easy Way
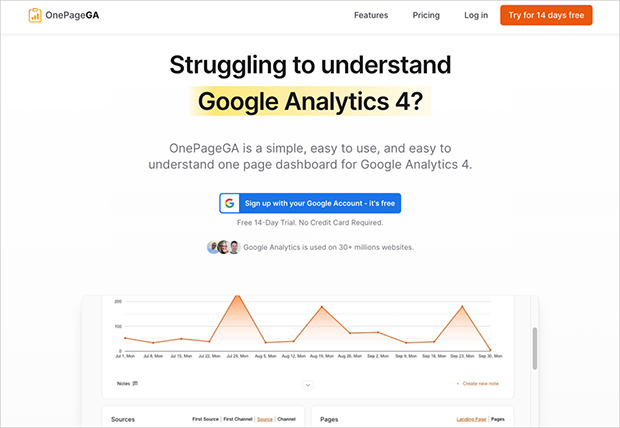
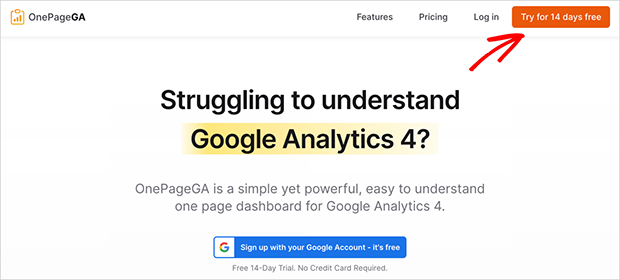
If GA4 feels like too much clicking and not enough clarity, OnePageGA can help.
OnePageGA gives you a clean, single-page view of your GA4 metrics
It’s a single-page GA4 dashboard that shows your most important metrics, including engagement rate and bounce rate, all in one place. You don’t need to build custom reports or dig through menus. Just connect your site, choose what you want to see, and get a clear view of your data.
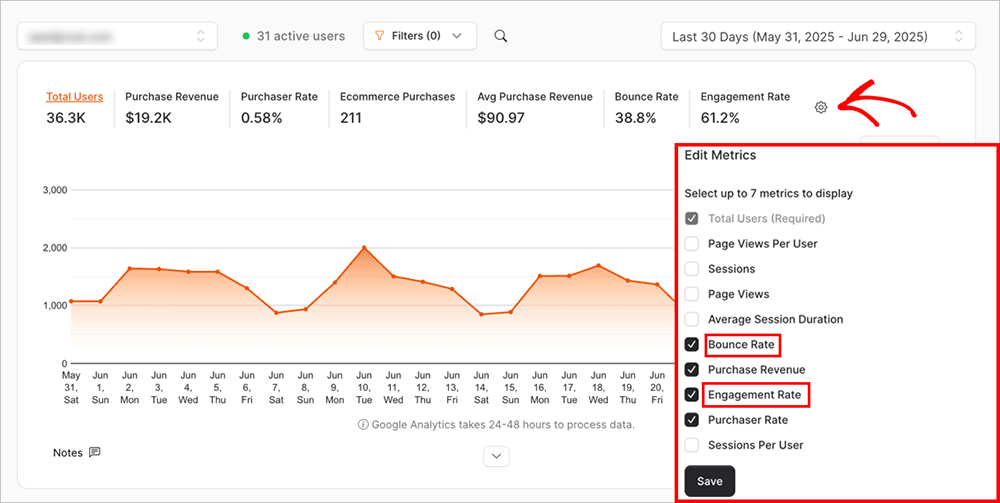
Here’s how to view both metrics in OnePageGA:
Click Edit Metrics
Select Engagement Rate and Bounce Rate
Apply filters by traffic source, page, or campaign
OnePageGA shows both engagement and bounce rate together — no report editing needed
You can quickly spot what’s getting results and what needs attention, without clicking through multiple reports or trying to decode the data.
FAQs About Bounce Rate vs Engagement Rate
Q: Is a high engagement rate good in GA4?
A: Yes. A high engagement rate means people are interacting with your site. Over 50 percent is a solid benchmark for most pages.
Q: Why is my GA4 bounce rate showing as 0 percent?
A: That usually means GA4 is tracking every session as engaged. This can happen if events fire automatically when the page loads, even if the user doesn’t interact. You can check your setup and fix auto-triggered events here.
Q: Can I compare bounce rate from Universal Analytics to GA4?
A: Not directly. The definitions are different, so comparing them one-to-one won’t give you accurate insights.
Q: What’s a good engagement rate for a blog?
A: Around 60 to 70 percent is a healthy range, but it depends on your topic, audience, and content format.
Q: Where can I see both metrics together without customizing GA4?
A: OnePageGA shows both engagement rate and bounce rate on a single dashboard, with no setup required.
What I Focus On (and You Should Too)
I’ve moved away from bounce rate as a core metric. These days, I rely on engagement rate to understand what content is actually working — especially when I’m testing campaigns or updating older blog posts.
If you’re still stuck clicking through GA4 trying to compare the two, give OnePageGA a try. It shows both metrics side by side so you can make faster, clearer decisions without the guesswork.
Want to keep digging into GA4? These guides might help:
Content Marketing Metrics That Matter: What I Track and Why
Posted on - Written By:
Stacey Corrin
Contents
Last year, I spent weeks writing a blog post I thought would be a hit. I checked my analytics the next day and saw a huge spike in pageviews — over 3,000 people in one weekend. I was thrilled.
But here’s the thing. Almost all of them bounced.
They didn’t click anything. No one signed up. No one shared it. For a while, I kept chasing pageviews, thinking that was the sign of success. It took me a while to realize I was tracking the wrong thing.
If you’ve ever opened Google Analytics 4 and felt completely lost, you’re not alone. It’s packed with data, but figuring out which numbers actually matter can feel overwhelming.
That’s what this guide is for.
I’ll show you the content marketing metrics that actually matter, how to track them in both GA4 and OnePageGA, and most importantly, how to use them to make better decisions about your content.
What Are Content Marketing Metrics?
Content marketing metrics are the numbers that show how your content is performing.
Content marketing isn’t a side tactic anymore. It’s a core part of most strategies — 73% of B2B marketers and 70% of B2C marketers use it to reach their audience.
These metrics tell you how people are finding your site, what they do after landing on a page, and whether your content is helping you reach goals like signups or sales.
Some common examples include:
Traffic — how many people visit your content
Engagement — how long they stay and what they interact with
Conversions — actions like purchases, form fills, or email signups
Behavior — things like scroll depth or which pages they visit next
I use these to answer simple but important questions. Is this post attracting the right audience? Are people actually reading it? Is it doing anything useful for the business?
Before I write something new or spend time promoting a piece, I always check these numbers. If something’s working, I want to know why. If it’s not, I want to fix it.
Here’s the part that took me a while to figure out. Some of these metrics matter more than others. A few will give you real answers. The rest just fill up space on a dashboard.
So instead of tracking everything, I focus on the ones that help me make better decisions.
Next, I’ll show you which metrics those are and how I use them.
The Content Marketing Metrics That Actually Matter
You don’t need to track everything. In fact, trying to monitor too many numbers can slow you down and make things more confusing than helpful.
What you really need is a small set of metrics that tell you what’s working, what’s not, and where to focus next. That’s what I rely on in my own content strategy.
Let’s start with the first one I always look at.
Traffic by Source
One of the first things I check is where my traffic is coming from. If most of my visitors are finding me through search, I know my SEO is working. If social or email is bringing in more clicks, that tells me where to focus next.
It also helps me spot gaps. I’ve seen campaigns where most of the effort went into social media — which makes sense, since 73% of content marketers use it. But when the traffic reports showed that search was performing way better, I knew I needed to shift my priorities.
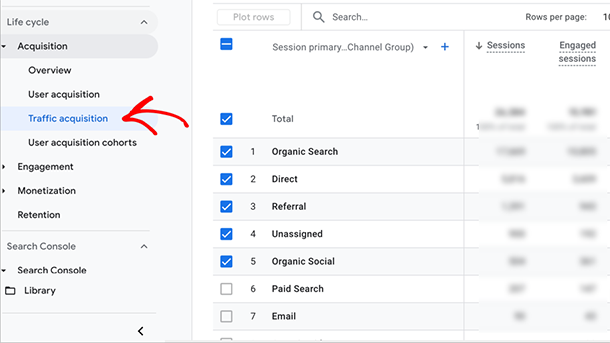
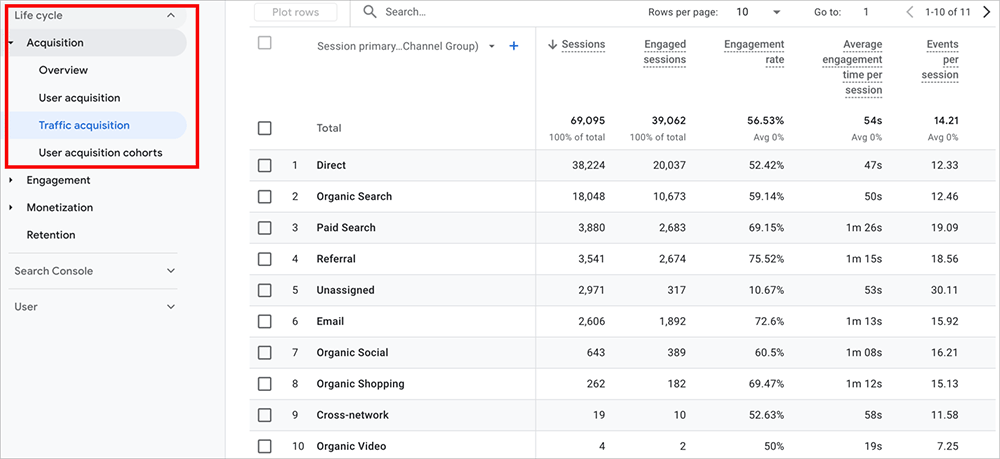
You can track traffic sources in GA4 by going to Reports » Acquisition » Traffic acquisition.
Google Analytics 4 Traffic Acquisition report showing source breakdown
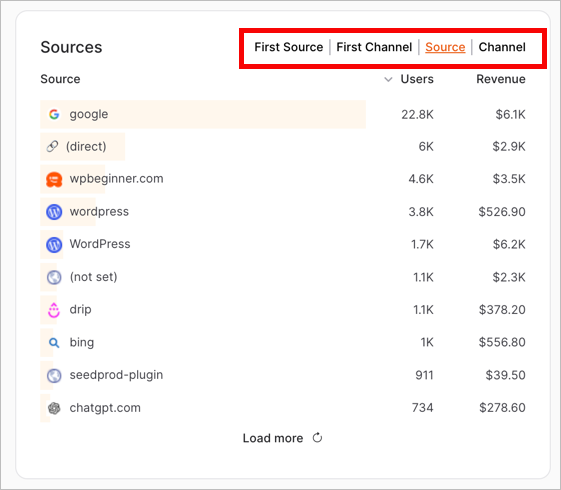
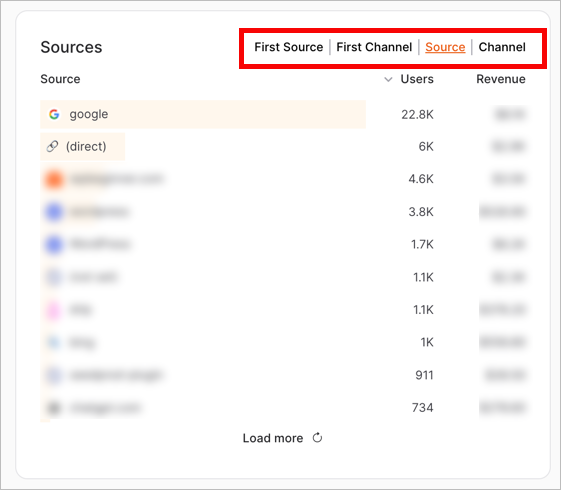
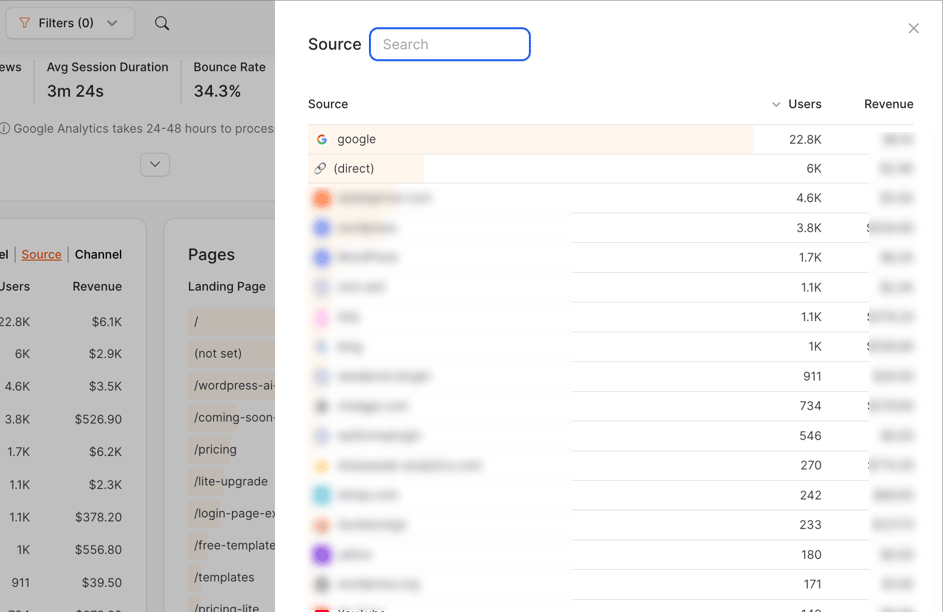
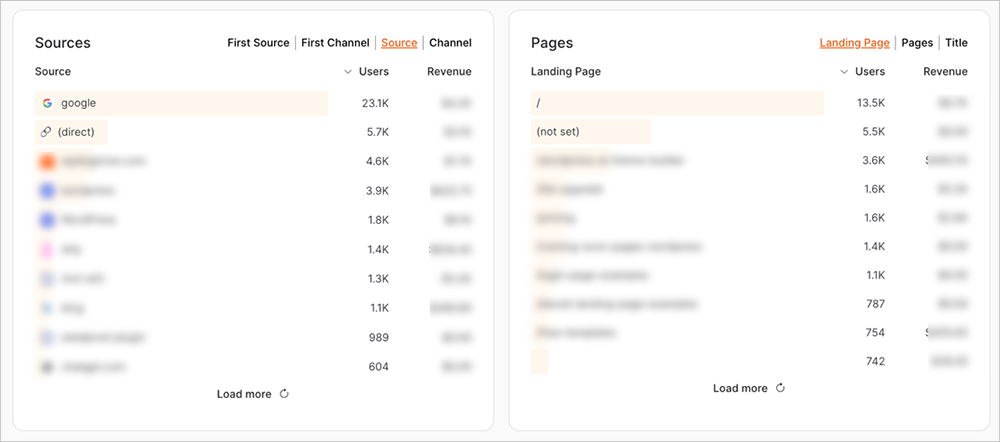
In OnePageGA, just open the Sources report and filter by Channel or Source/Medium.
OnePageGA Sources report filtered by Channel
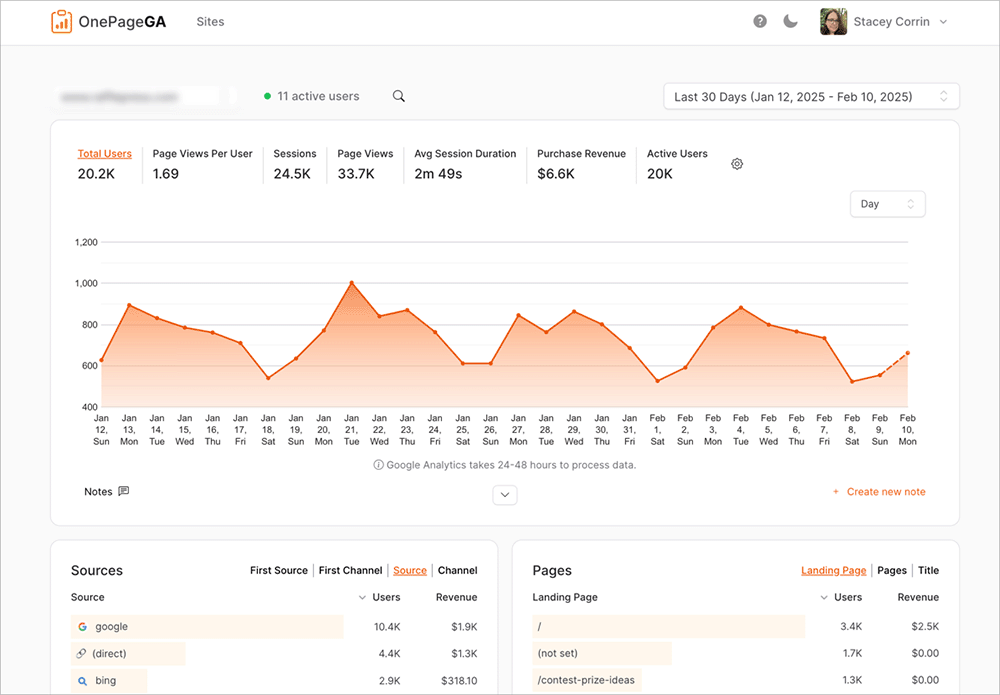
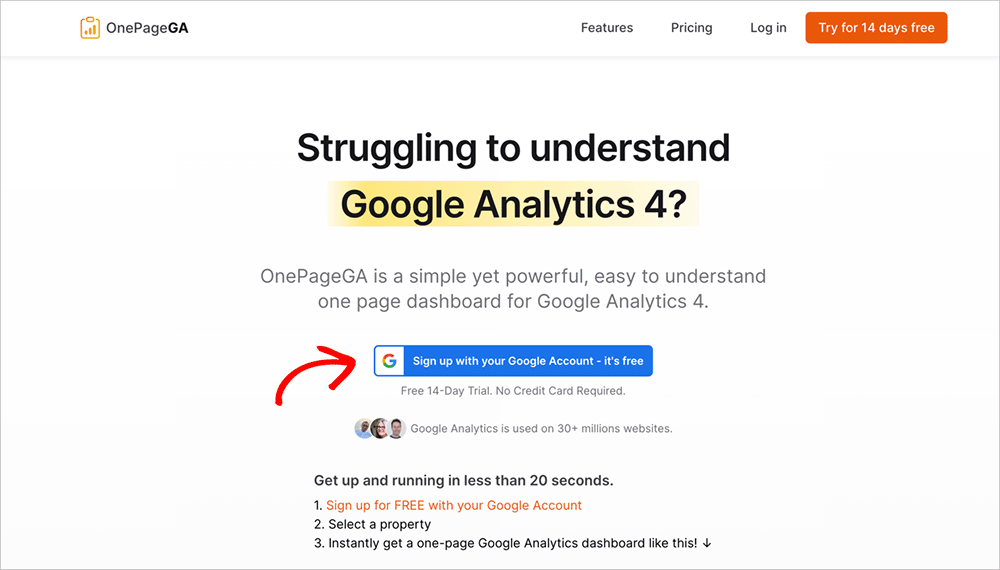
If you haven’t used OnePageGA yet, it’s a simple Google Analytics 4 dashboard that shows all your key metrics on one screen. It connects directly to your GA4 account but removes all the noise, so you can get answers fast without clicking through endless menus.
OnePageGA dashboard showing all key metrics in one place
If you’re running any kind of campaign, I always recommend using UTMs. That way, you can see exactly which links are driving results without having to guess later.
Engagement Rate
GA4 doesn’t show bounce rate by default anymore, and honestly, I don’t miss it. These days, I use engagement rate instead. It tells me how many people are actually interacting with my content instead of just clicking and leaving.
In GA4, a session is counted as engaged if the visitor stays for more than 10 seconds, views at least two pages, or triggers a conversion event. So when I see a high engagement rate, I know people are sticking around and doing something useful.
This matters because attention is hard to earn. One study found that personalized content creates a 20% increase in sales opportunities, but only if people actually engage with what you’re publishing.
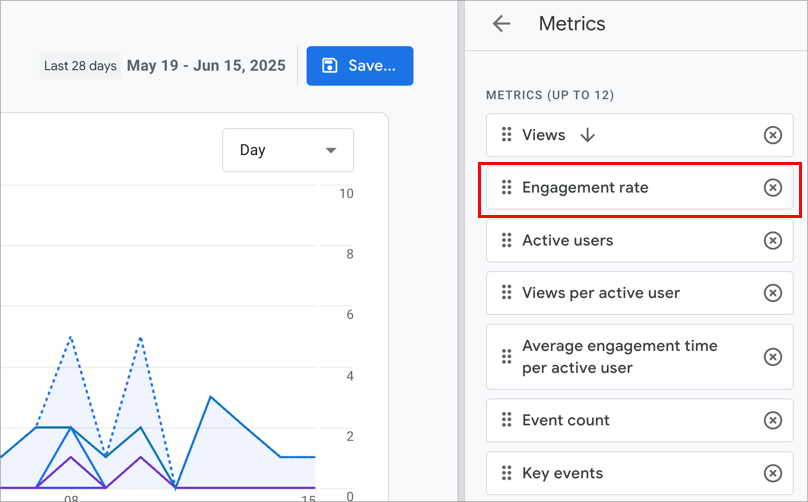
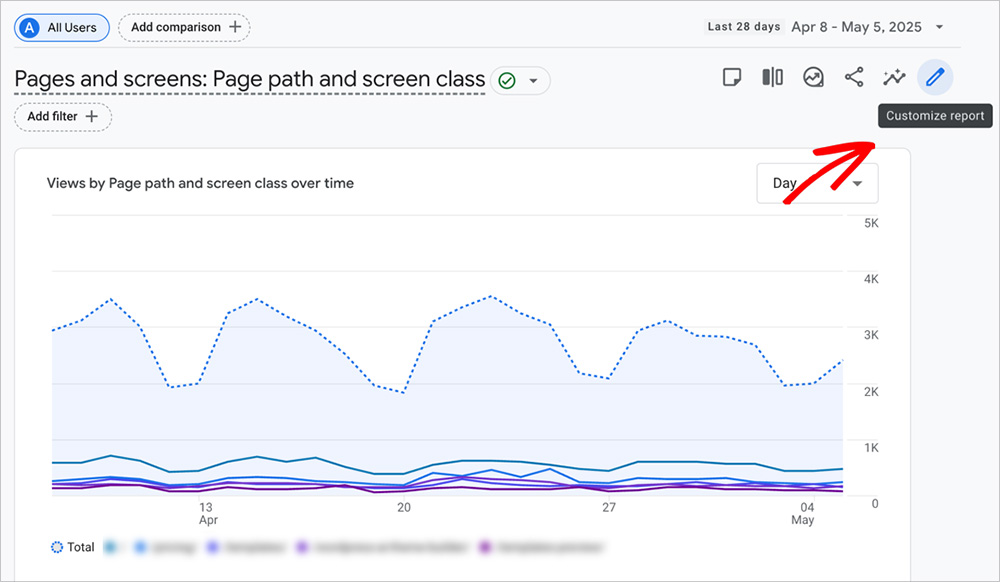
To check engagement rate in GA4, go to Reports » Engagement » Pages and screens, then click the pencil icon to customize the report.
Customizing GA4 to add Engagement Rate metric
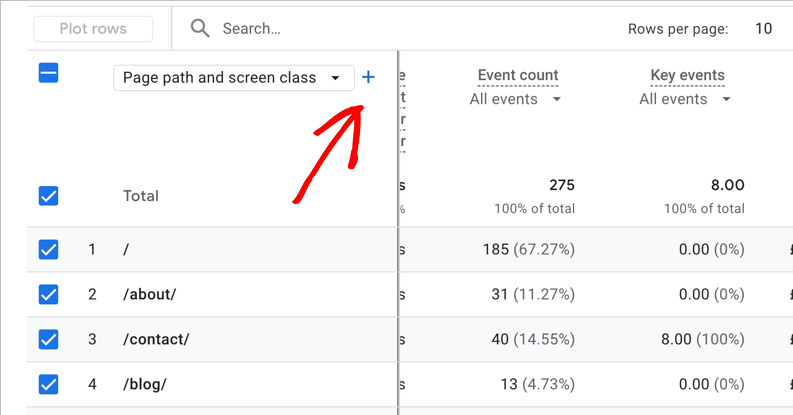
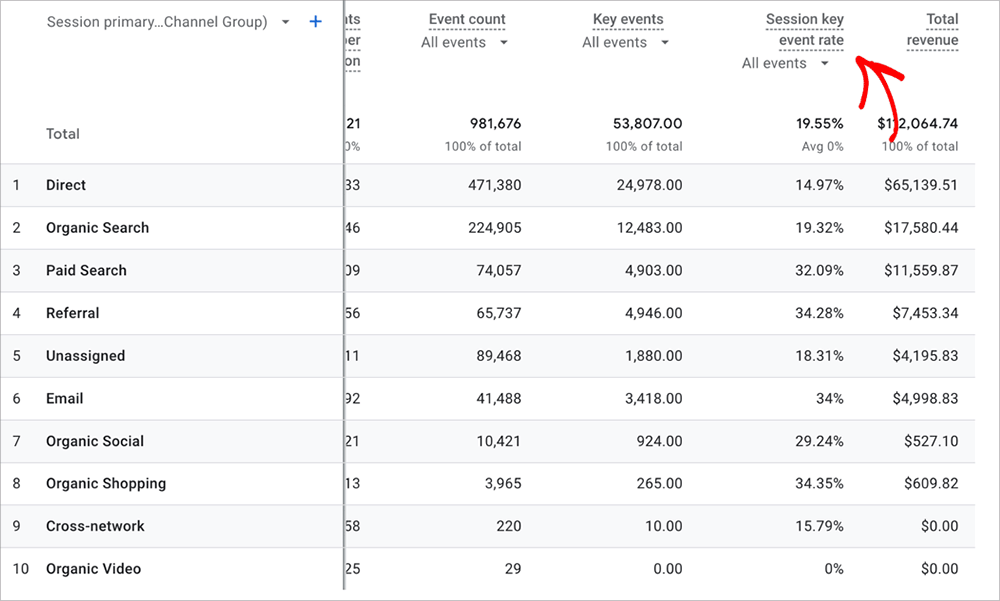
From there, you can add Engagement Rate as a visible metric.
GA4 report showing Engagement Rate column
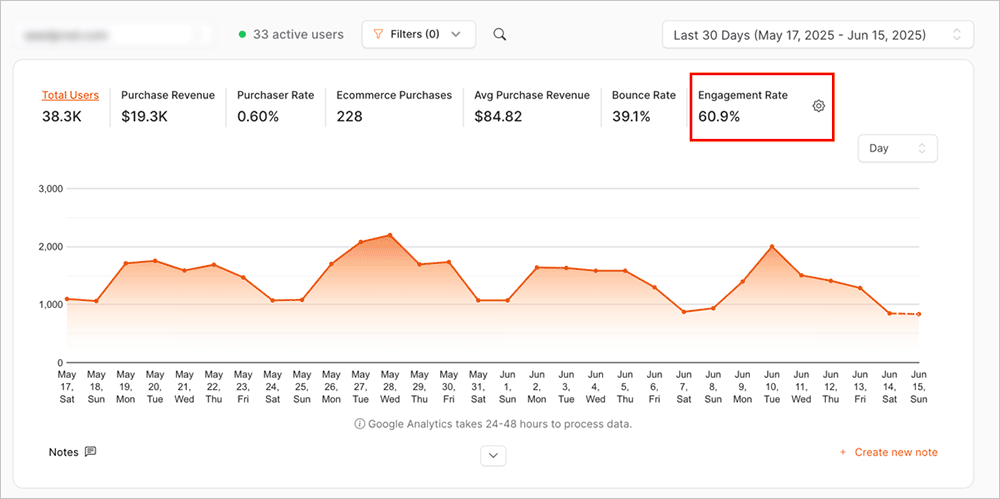
In OnePageGA, you can see it right on the main dashboard or drill into it in the Pages report.
Engagement Rate displayed in the OnePageGA dashboard
I use this number all the time to spot weak intros or pages that need a clearer call to action.
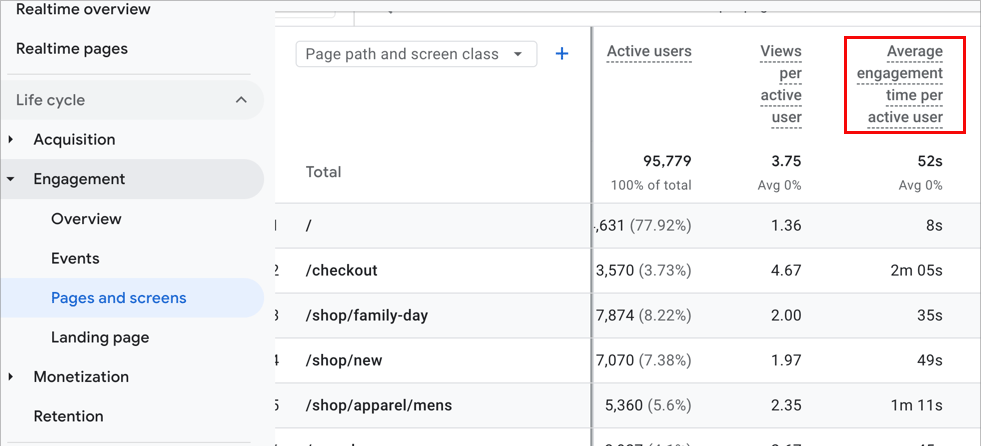
Average Engagement Time
Average Engagement Time shows how long people are actively paying attention to your content. It’s not just how long the tab is open, it’s how long they’re actually scrolling, clicking, or interacting with the page.
I use this metric when I want to see if a piece is really holding interest. Low numbers usually mean something went wrong. Maybe the headline didn’t match the content, or the intro lost people before they got to the good stuff.
But when engagement time hits a minute or more, I know readers are sticking around. That usually means they’re reading, exploring, and getting value from what they’re seeing.
In GA4, you can find this under Reports » Engagement » Pages and screens.
Average Engagement Time metric shown in GA4 report
Key Conversions / Events
At the end of the day, this is the metric that matters most — are people taking action?
For me, that means tracking things like email signups, purchases, or contact form submissions. If a piece of content is getting views but not leading to any conversions, I know something’s missing. Maybe the CTA isn’t clear enough. Maybe the offer doesn’t match the reader’s intent.
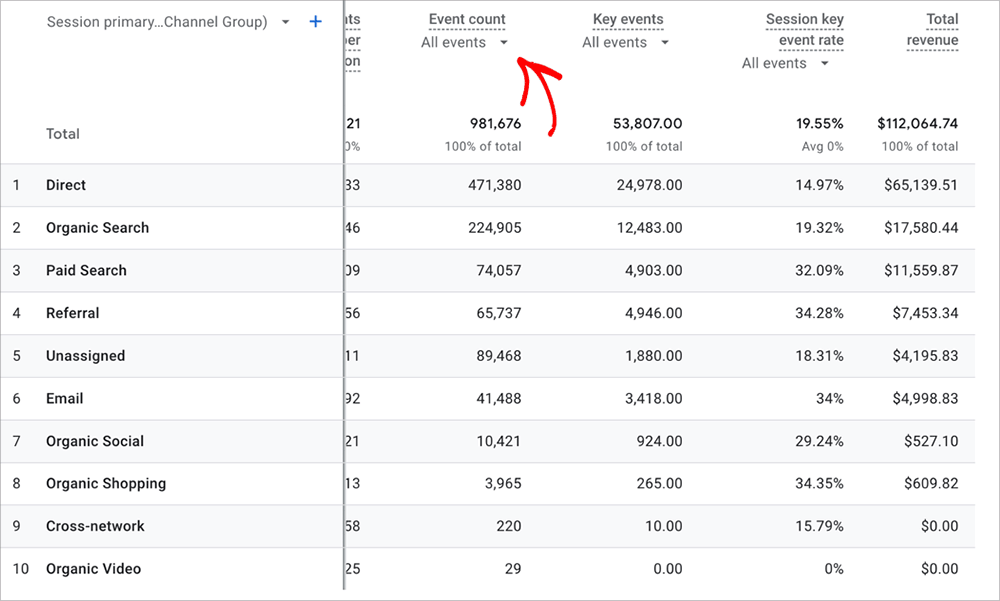
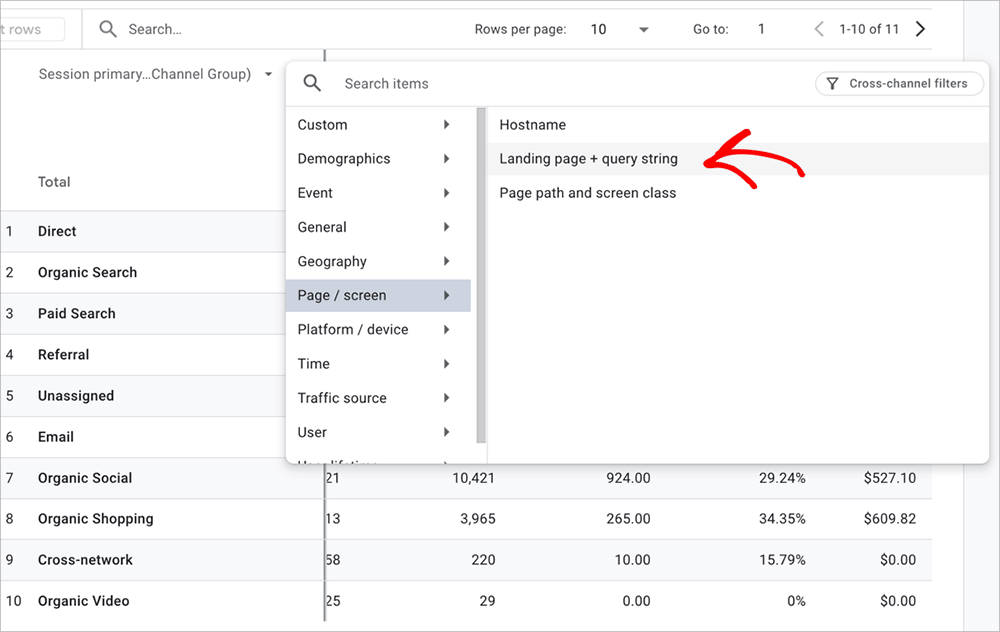
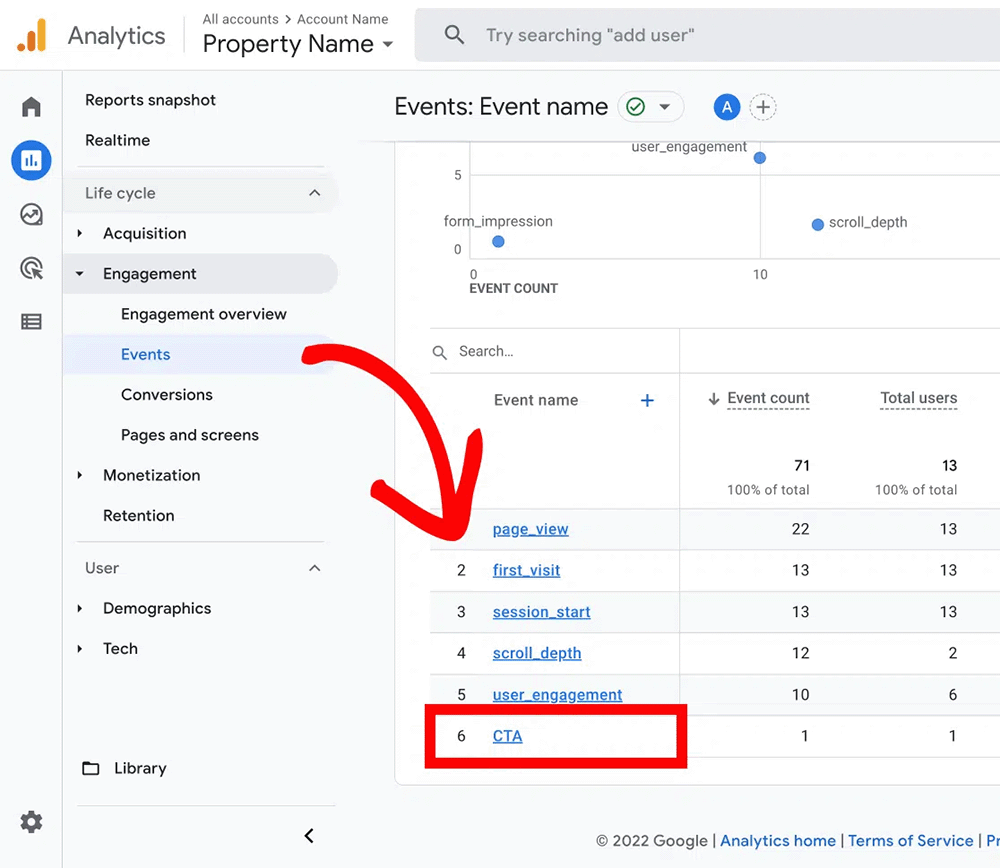
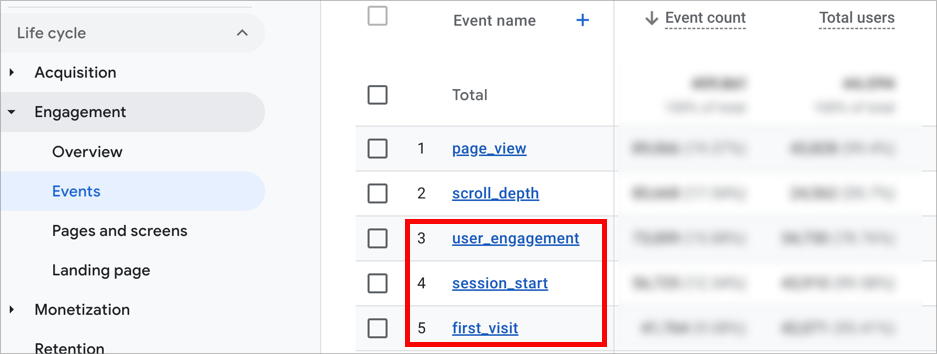
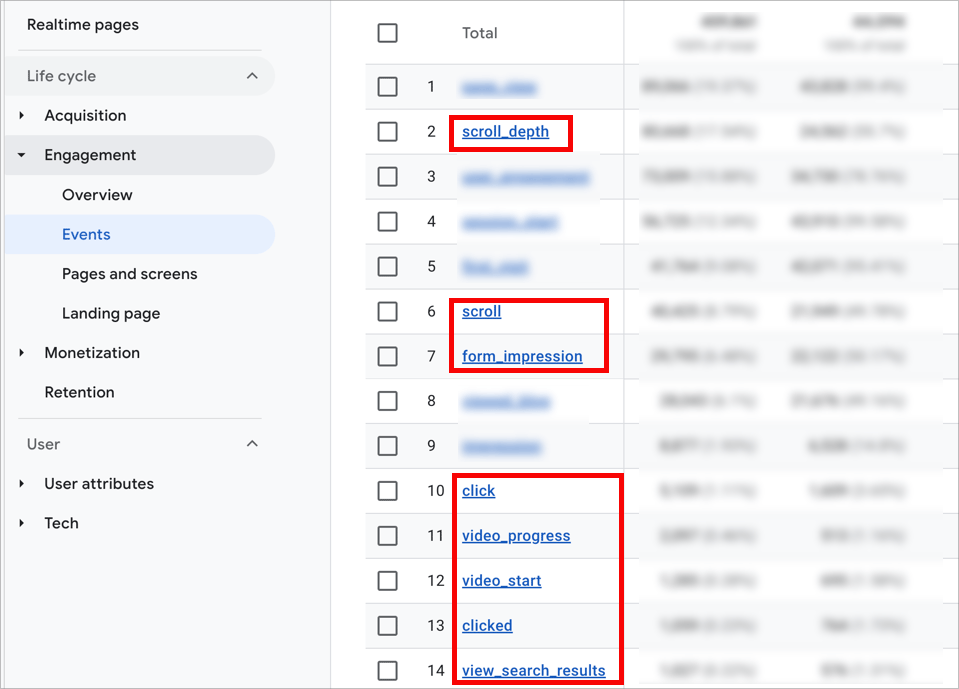
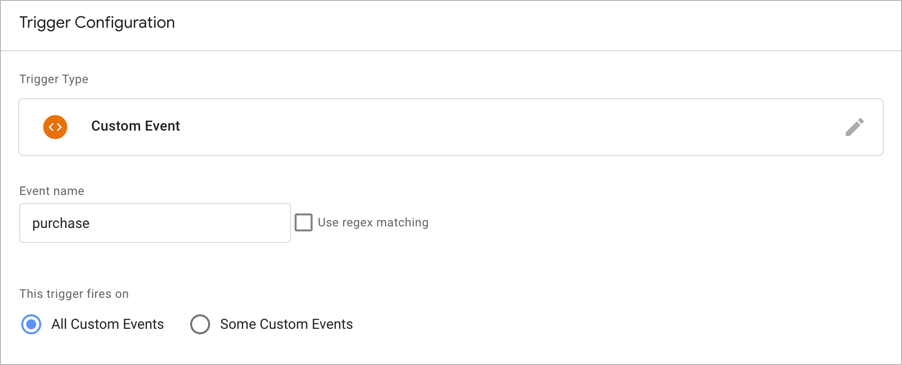
GA4 lets you track these actions as either events or conversions. You can find them by going to Configure » Events, then mark the ones that matter most to you as conversions.
Viewing events in the GA4 Traffic Acquisition report
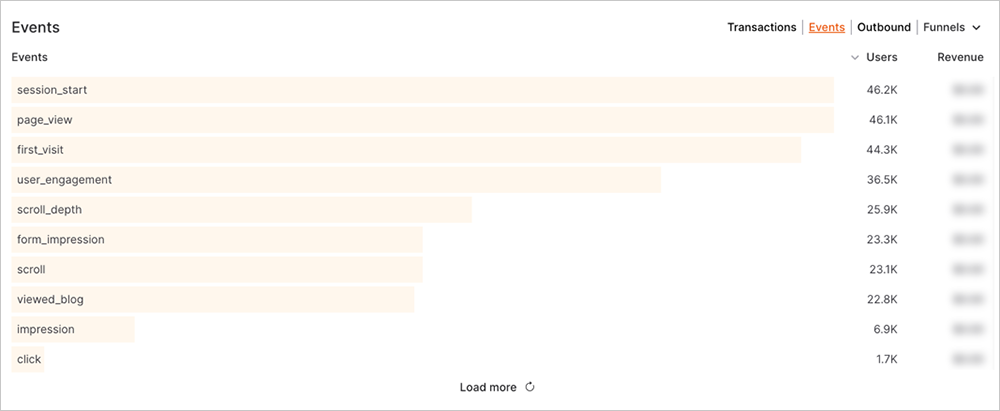
In OnePageGA, it’s much faster. Just open your Events report and filter by the conversion actions you care about — things like generate_lead, sign_up, or purchase.
Filtering for conversion events in OnePageGA’s Events report
This is how I connect content to actual results. Views are nice, but conversions show whether it’s doing real work.
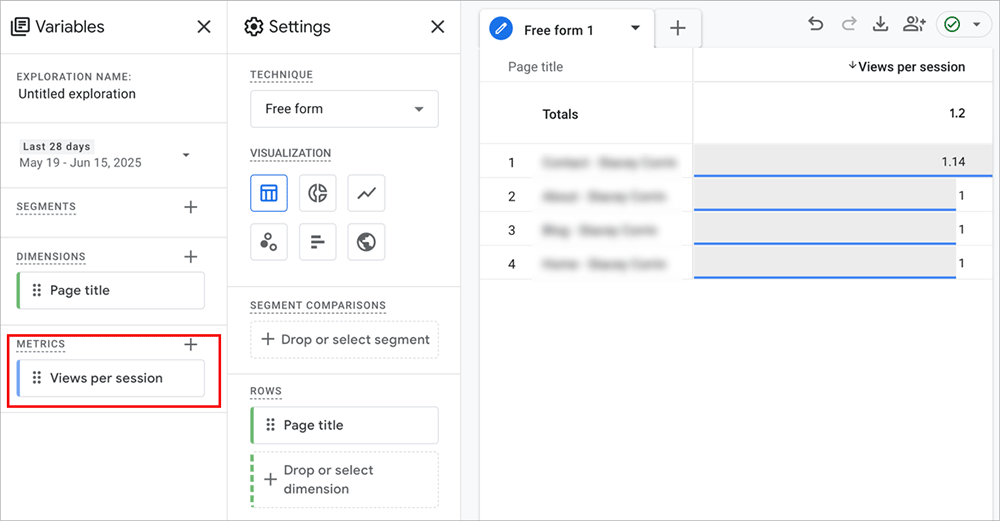
Vies per Session
This metric, formerly called “Pages per Session” in Universal Analytics, shows how many pages someone views during a single session. I use it to get a feel for how engaging and connected my content is. If people are reading one post and then checking out more, that tells me I’m on the right track.
But if most sessions stop after one page, it might mean my internal links aren’t strong enough or the next step isn’t clear. Sometimes it’s just a layout issue. Either way, this number helps me spot it.
In GA4, you’ll need to use Explore reports to view Views per Session, since it’s not available in standard reports.
Explore report in GA4 showing Views per Session
It’s a small metric, but it gives me useful clues about whether my site structure and content flow are doing their job.
Backlinks and Referral Traffic
Backlinks and referral traffic help you see which other websites are sending visitors your way. I check this to find out which partnerships, mentions, or guest posts are actually driving results.
It’s also a helpful way to spot content that’s building authority. When credible sites link to you, it often means the content is useful, and that can give your SEO a boost too.
In GA4, head to the Acquisition report and filter by Referral to view this traffic.
Referral traffic sources report in GA4 Acquisition section
If you want to see exactly who’s linking to you, tools like Google Search Console, Ahrefs, or Semrush will give you the backlink data GA4 doesn’t show.
This is one of the ways I decide which posts are worth updating, promoting, or repurposing. If someone’s already linked to it, that’s a signal it’s worth keeping fresh.
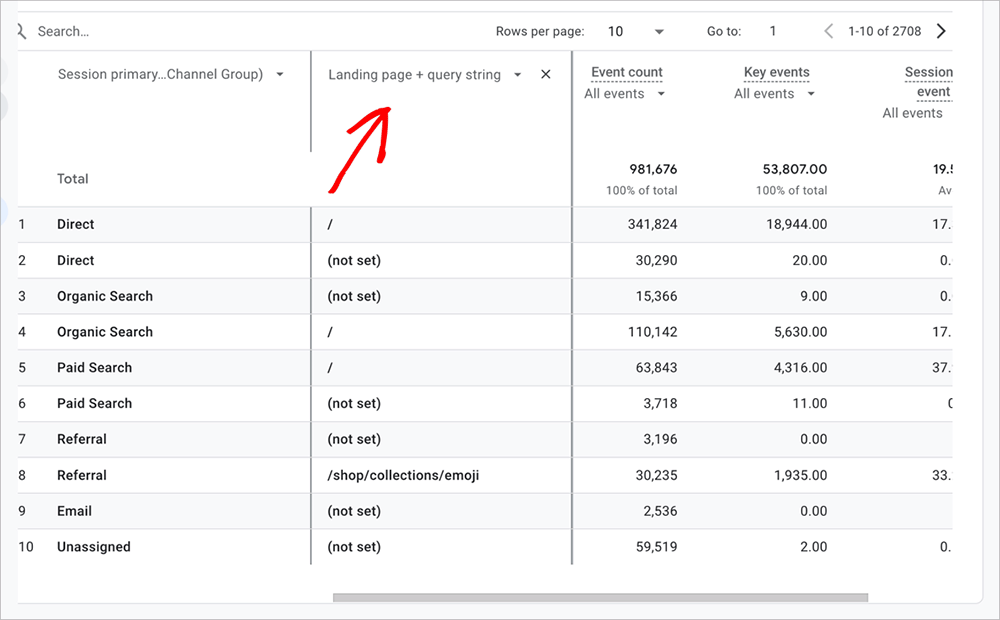
Top Landing Pages
Your landing pages are the first thing people see when they visit your site. I always keep an eye on which ones bring in the most new users. These are the pages doing the most work, whether the traffic is coming from search, social, or other sites.
When a landing page is performing well, I ask a few simple questions. Is there a clear call to action? Does the content feel current? Can I add internal links to help people keep exploring?
In GA4, you can find this information by going to Engagement » Landing page.
GA4 report showing Landing Page performance
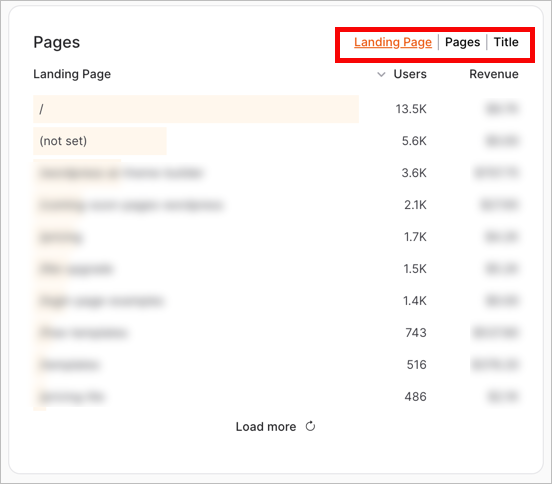
In OnePageGA, open the Pages report and sort by Users to see which content is attracting first-time visitors.
Pages report in OnePageGA sorted by most users
If you want to improve conversions or get more value from your traffic, this is one of the best places to start.
How to Use These Metrics to Improve Your Content
By now, you’ve seen how each of these metrics can help you spot what’s working and what needs improvement. Here’s how I pull it all together when I’m reviewing content:
Low engagement rate? Rewrite the intro or break up the layout.
High time on page but no conversions? Add or improve your call to action.
Top landing page? Update it, link to it more, or turn it into a lead magnet.
Low scroll depth? If you’ve enabled scroll tracking, check where people drop off. I’ve used that to spot weak sections in tutorials and blog posts that lose readers halfway through.
I usually check these once a week for new content, then review everything else about once a month. It doesn’t take long, and it keeps my content moving in the right direction.
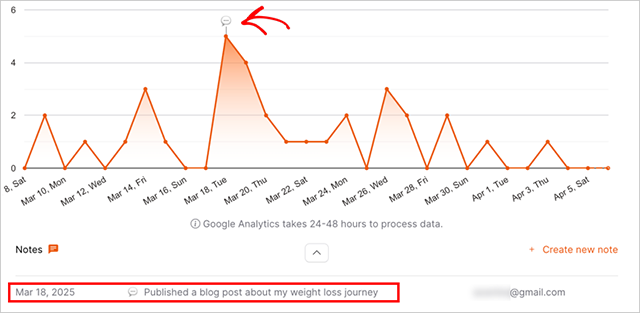
If you’re making changes, I also recommend adding annotations in GA4 or OnePageGA. It helps you see what changed and why performance shifted later on.
Adding an annotation in OnePageGA to mark content changes
Want Content Marketing Metrics in One Place?
GA4 is powerful, but let’s be honest, finding your way around it can be a pain. Even simple questions take too many clicks, and important metrics are buried in different reports.
It’s a clear, one-page dashboard that connects to your Google Analytics account and shows all your key content metrics in one place. You can filter by source, page, campaign, or event without having to dig through endless menus.
If you want to spend less time clicking around and more time improving your content, it’s worth a look.
A metric is just a data point, like bounce rate or average time on page. A KPI (key performance indicator) is a metric that’s tied to a goal. For example, if your goal is to grow your email list, your KPI might be signups per blog post.
Should I track bounce rate in GA4?
No — GA4 doesn’t even show bounce rate by default. Use engagement rate instead. It gives a more accurate picture of whether visitors are actually interacting with your content.
Can I track content performance in real time?
Yes. Both GA4 and OnePageGA let you see real-time activity on your site. It’s helpful for monitoring traffic during launches or when you publish a new post.
Do these metrics apply to all types of content?
They do, but how you use them depends on the content. A blog post might focus more on engagement time and scroll depth. A landing page or product page might be more about conversions.
The Simple Metrics I Keep Coming Back To
Content marketing gets easier once you know what to measure. You don’t need fancy reports or dozens of charts — just a few key numbers that help you make better decisions.
Start with the basics, check them regularly, and use what you find to improve one thing at a time. That’s how I’ve grown my own sites, and it’s still the process I trust most.
If you want a simpler way to track what’s working, try OnePageGA. It shows all your key content metrics on one screen, no setup headaches or confusing menus.
How to Find Average Session Duration in Google Analytics
Posted on - Written By:
Stacey Corrin
Contents
Some metrics in GA4 are so buried, it feels like you need a treasure map just to find them.
One of the most frustrating ones was average session duration. I used to rely on it all the time in Universal Analytics to spot weak pages and figure out what was keeping visitors engaged. But in GA4? It’s renamed, hidden, and way too easy to miss.
If you’ve been digging around and still can’t find it, you’re not alone. In this guide, I’ll walk you through exactly how to find average session duration in Google Analytics 4, what the updated metric actually means, and how I track it faster using OnePageGA.
What Is Average Session Duration in GA4?
In Universal Analytics, average session duration told you how long people typically stayed on your site. It was one of those quick-glance metrics that helped me spot which pages were holding attention and which ones weren’t.
In GA4, that metric has been replaced by average engagement time per session, and it works a little differently. I still call it session duration out of habit, but the above label is the correct name.
Instead of counting the total time someone spends from entry to exit, GA4 only tracks active time. If someone opens your site and walks away for five minutes, that idle time doesn’t count.
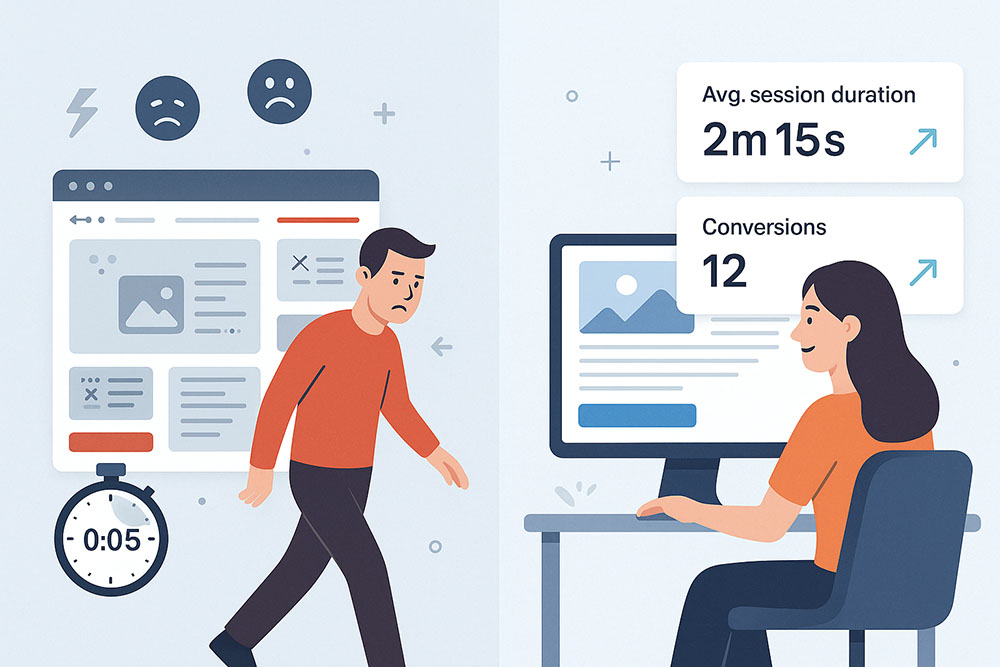
Even with that change, I still find it useful. If people are leaving after a few seconds, there’s usually a reason. It might be slow loading, poor content, or a mismatch between the page and their search intent. But when I see engagement time ticking up, especially past the one- or two-minute mark, that usually tells me visitors are sticking around, scrolling, reading, and maybe even converting.
Higher engagement often comes down to better content, faster loading, and clear intent.
On one of my own landing pages, the average session time was under a minute. After tweaking the headline and moving the CTA higher, people stayed longer and conversions doubled.
Most sites I work with average somewhere between 1 and 2 minutes per session. Databox reports a median of 77.61 seconds for B2B and 92.33 seconds for B2C, which lines up with what I’ve seen. In niches like fintech or SaaS, engagement times often reach 4 to 5 minutes.
Finding average session duration in GA4 isn’t hard, but it does take a few steps since it’s not included in your default reports.
Here’s how to do it:
Step 1: Open the Engagement Report
First, log into your Google Analytics account.
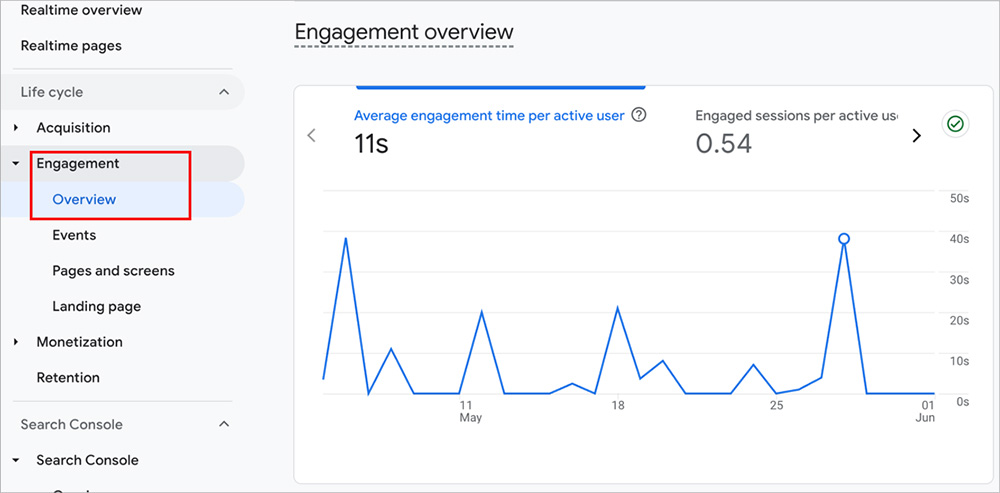
From the left-hand menu, go to Reports » Engagement » Overview.
Engagement overview report in GA4
This gives you a general view of how people are interacting with your site, including key metrics like engaged sessions, engagement rate, and engagement time.
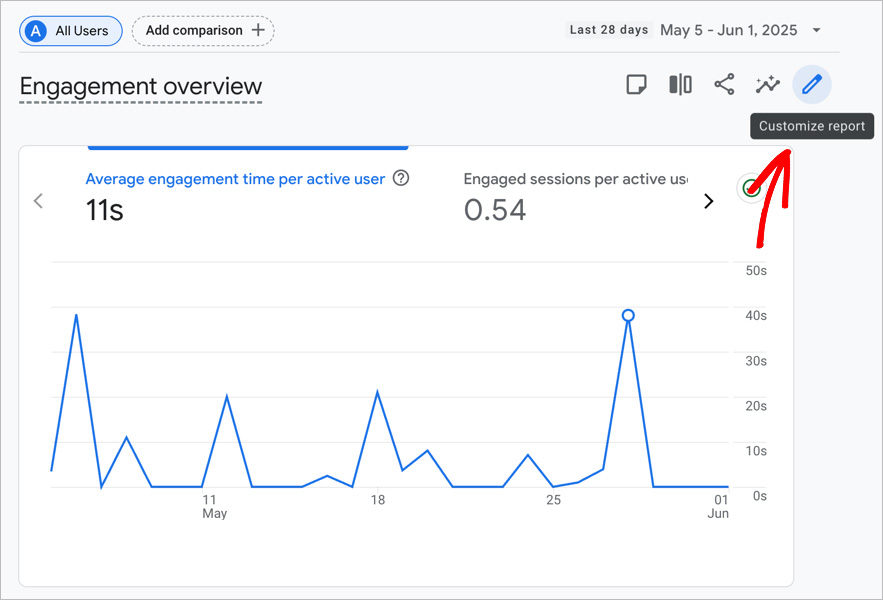
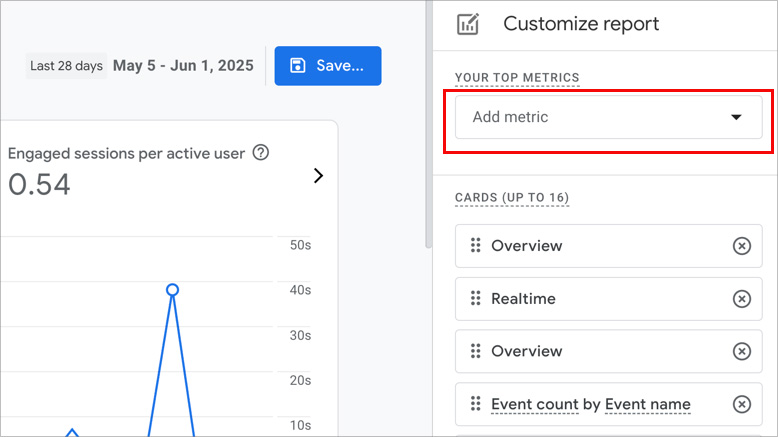
Once you’re in the Engagement Overview report, look for the pencil icon in the top-right corner of the screen. Click it to enter Edit mode.
Editing the Engagement Overview report in GA4
This lets you add or remove metrics from the report, so you can manually include the session duration metric.
Step 3: Add a Session Duration Metric
In the report editor, click on Metrics in the right-hand panel. Then click Add metric.
Adding a metric to custom GA4 report
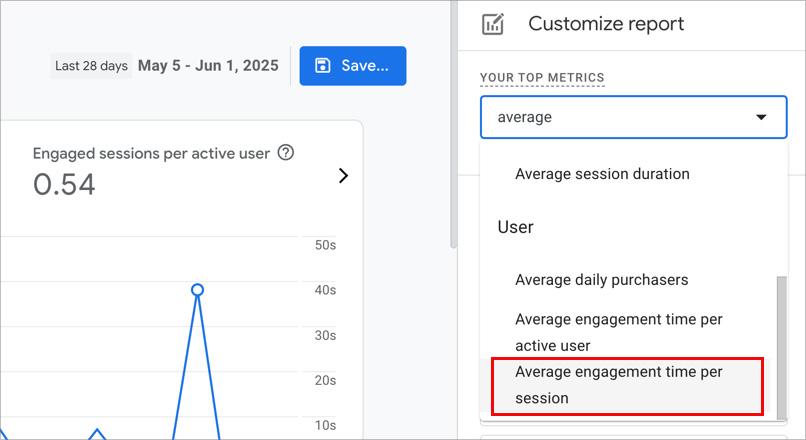
Search for and select Average engagement time per session.
This is the GA4 version of average session duration. It shows how long users were actively engaging with your site during a session, not just how long the tab was open.
Adding the Average engagement time per session metric to a custom GA4 report
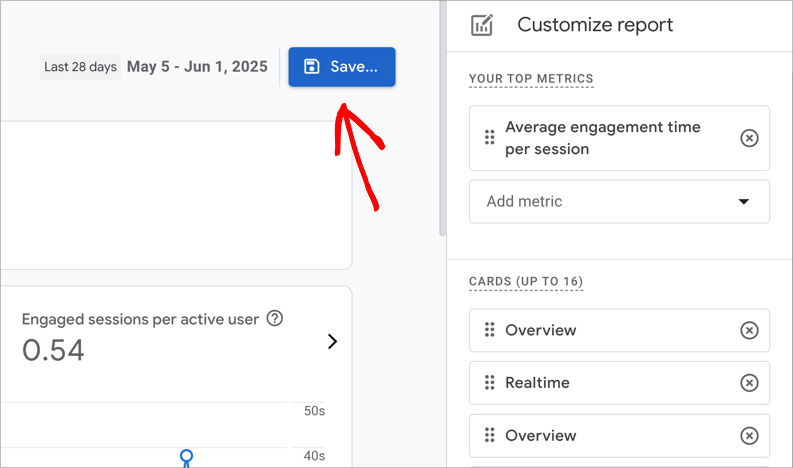
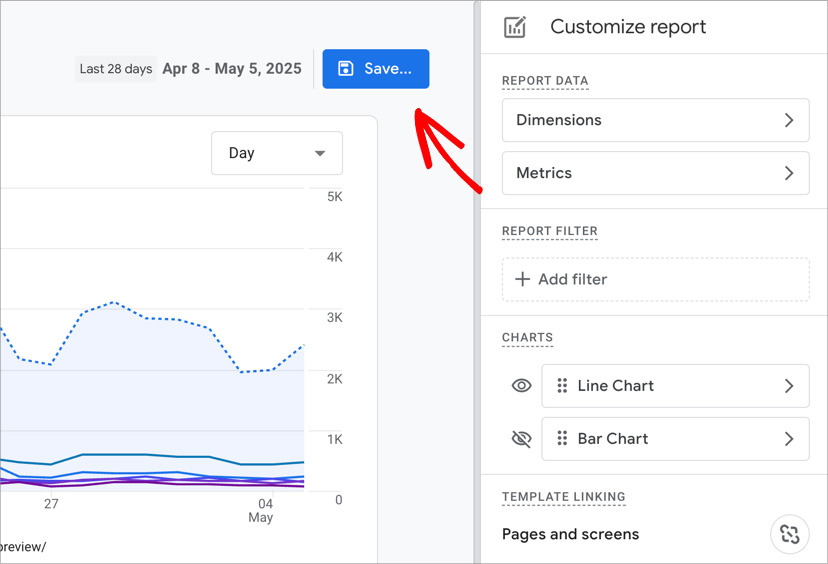
Once your report includes the metrics and dimensions you want, click the Save button in the top-right corner.
Save your custom GA4 report
Choose Save as a new report, give it a name like “Session Duration Overview,” and click Save again.
This way, you won’t have to rebuild the report every time you log in. You can find it anytime under Library » Reports.
Step 4: (Optional) Export and Calculate
If you want to match the old Universal Analytics metric more closely, you can calculate it manually.
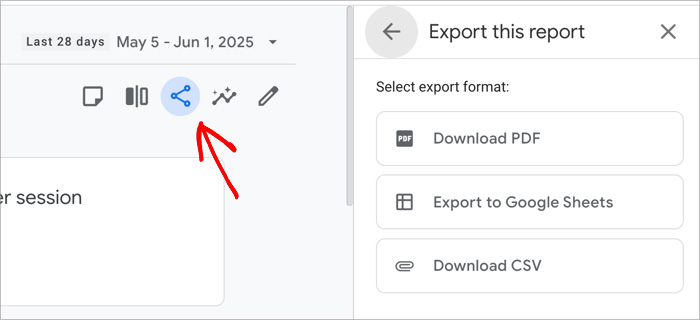
Click the Share icon at the top of the report, then choose Download file » CSV.
Download your custom GA4 report
In your spreadsheet, divide the Total engagement time by the Number of sessions. This gives you a rough version of traditional average session duration.
For example, if your report shows 15,000 seconds of total engagement time and 500 sessions, the calculation would look like this:
15,000 ÷ 500 = 30 seconds
So your average session duration would be around 30 seconds.
It’s not perfect, but it can help if you’re comparing old data with your GA4 setup.
Step 5: Add a Secondary Dimension
To dig deeper into your session data, click the “+” icon next to the primary dimension in your report.
Add a secondary dimension to your ga4 reprot
This lets you break down session duration by things like:
Page path – see which pages are holding attention
Traffic source – compare how users from search, social, or email behave
Device category – check whether mobile or desktop users stay longer
Adding a secondary dimension helps you understand not just how long people stay, but also where and why they’re spending that time.
When I compared traffic sources, I noticed users from my newsletter were staying for over 3 minutes, while Facebook traffic dropped off in under 30 seconds. That helped me shift focus to channels that brought in more engaged visitors.
How to View Session Duration in OnePageGA
If you’re tired of jumping through hoops just to see how long people stay on your site, OnePageGA makes it much easier.
OnePageGA
It’s a clean, beginner-friendly dashboard that connects to your GA4 account and helps you create simple GA4 reports without digging through menus. That includes session duration, which shows up right on your main dashboard without any extra setup.
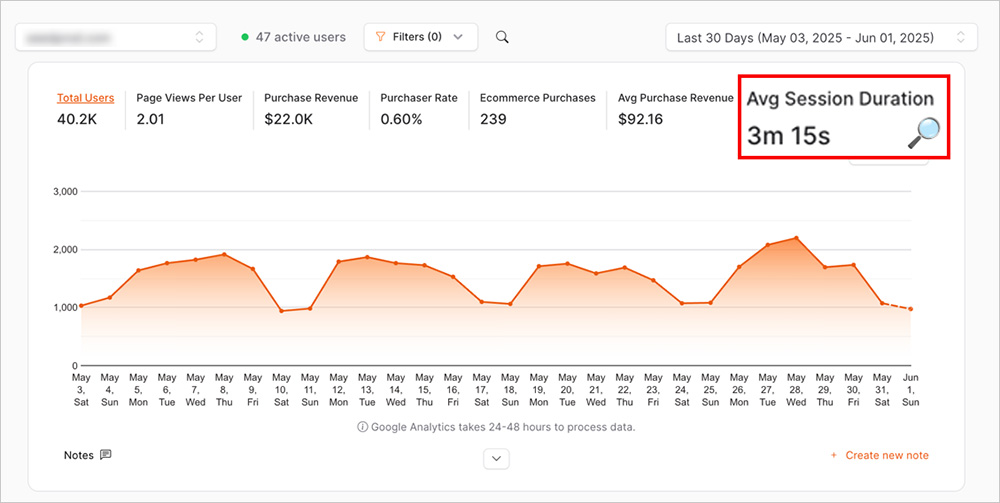
OnePageGA dashboard with average session duration
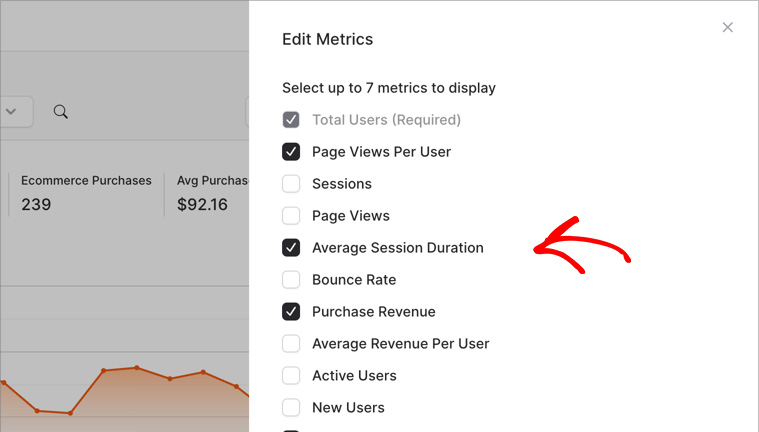
You can also customize your view. Click the Edit Metrics icon and turn on Average Session Duration if it’s not already selected.
Edit metrics to show Average Session Duration in OnePageGA
From there, you can filter the data by:
Page
Traffic source
Campaign
Device
I used this to check how different landing pages were performing. Visitors were spending more than 4 minutes on the pricing page, which gave me the confidence to increase my ad budget for that campaign. The numbers helped confirm that the page was doing its job.
With OnePageGA, it only takes a few clicks to see the data that matters most.
Smart Ways to Use Average Session Duration
It’s easy to assume that longer session times are always better, but that’s not always true. Sometimes people stay longer because they’re confused or stuck. Other times, a short session means someone found exactly what they needed right away.
Here’s what I’ve learned from using this metric on my own sites.
What Not to Do
Don’t assume a longer session automatically means better performance
Don’t compare GA4 session duration to old Universal Analytics reports — they use different tracking models
Don’t look at session time on its own. It’s more useful when you pair it with bounce rate, conversion rate, or scroll depth.
What to Do Instead
Use it to spot weak pages or traffic sources that aren’t bringing in engaged visitors
Watch for changes over time when you update your content or layout
The European Sealing Association made some key improvements to their site and increased their average session duration to 56 seconds. They also saw a 3% drop in bounce rate and a 51% increase in page views (source).
Compare your numbers to others in your industry to see if you’re in a healthy range
Here are some average session duration benchmarks, based on data from Hike SEO:
Industry
Average Session Duration
Automotive
2:41
Cybersecurity
2:49
Fintech
3:28
Real Estate
3:52
B2B SaaS
4:26
Financial Services
4:56
I also like to pair session duration with scroll tracking. You can track scroll depth and other events to get a fuller picture of how people interact with your content.
If visitors are spending time and scrolling to the end, that usually tells me they’re reading and engaging, not just idling with the tab open.
FAQs About Average Session Duration
Why can’t I see average session duration in GA4?
It’s not included in the default reports. You’ll need to customize a report and add Average engagement time per session as a metric.
What’s the difference between engagement time and session duration?
Engagement time only includes active time like scrolling, clicking, or watching a video. It doesn’t count time spent with the tab open in the background.
What’s a good average session duration?
It depends on your niche and content. Most websites average between 1 and 2 minutes. Some industries, like B2B SaaS and financial services, often see 4 minutes or more.
Can I compare GA4 session duration to Universal Analytics?
Not directly. GA4 uses a different tracking model, so the numbers won’t line up. It’s better to treat GA4 as a fresh baseline and focus on trends moving forward.
Wrapping Up: Make Session Time Work for You
Average session duration is still one of the clearest ways to understand how people engage with your website. Even though GA4 makes it harder to find, it’s a metric worth paying attention to.
It helps you see what’s working, where users might be losing interest, and how changes to your content or layout affect real behavior. The key is not just finding the number, but knowing how to use it.
If GA4 feels like too much effort, OnePageGA gives you a faster, simpler way to track session duration alongside all your other key metrics, with no digging required.
Google Analytics Not Working? Here’s How to Fix It Fast
Posted on - Written By:
Stacey Corrin
Contents
Last month, I opened Google Analytics to check on a friend’s campaign and saw zero users. Not one. My stomach dropped.
If you’ve been there, you know the feeling. You’re expecting to see a steady stream of data, and instead it looks like your entire website vanished. Google Analytics not working is more common than most people realize, especially with all the changes and limitations baked into the newer version.
In this guide, I’ll show you the exact steps I take when GA4 stops working, even if you don’t have any technical experience.
Common Reasons for Google Analytics Not Working
These are the first things I check when GA4 suddenly goes quiet. In my experience, it’s usually something small. But it’s easy to miss if you don’t know where to look.
1. The Tracking Code Isn’t Firing
When GA4 stops recording data, this is the first thing I check. If the GA4 tag isn’t firing, none of your tracking will work. Make sure it uses the gtag.js snippet, which is the recommended setup for GA4.
Your GA4 tag needs to be installed across your entire site, not just the homepage. Even missing it on one key landing page can throw off your reports. The tag should use the gtag.js snippet, which is the recommended setup for GA4 tracking.
You’re looking for your Measurement ID, which should start with G-. Make sure it matches the one listed in your GA4 data stream settings, which you’ll find under Admin » Data Streams.
GA4 Web Stream Details
If it’s not showing up, the tag might be missing, misconfigured, or blocked by another plugin or script.
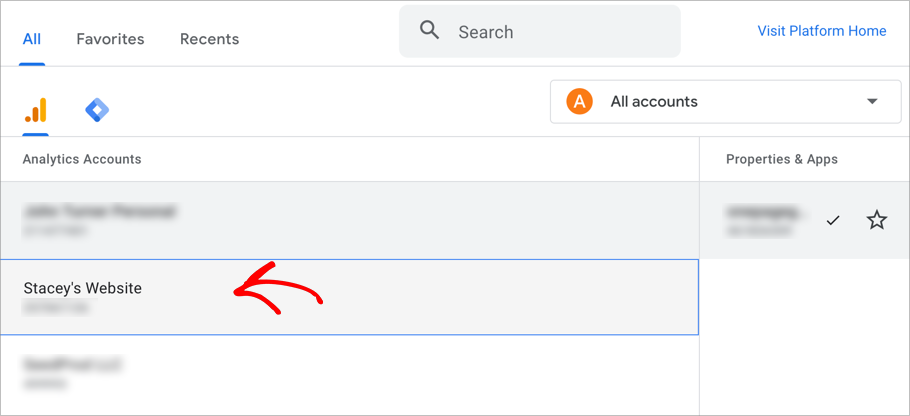
2. You’re in the Wrong Property or Account
This has tripped me up more times than I care to admit. If you manage more than one site or work with clients, it’s surprisingly easy to open the wrong GA4 property.
The interface doesn’t make it obvious which property you’re looking at, especially if your sites have similar names. I’ve had moments where I thought tracking was broken, only to realize I was checking a staging site or someone else’s account entirely.
Before you panic, double-check the property name in the top left corner of GA4. It only takes a second and might save you a lot of time.
Choosing a GA4 Property
3. Ad Blockers and Cookie Banners Are Interfering
Sometimes GA4 is working just fine, but the data never makes it to your reports.
Ad blockers like uBlock, Ghostery, and Brave can block Google Analytics scripts completely. If your audience is even slightly tech-savvy, there’s a good chance some of them are invisible in your stats.
Some browsers also apply a content security policy that can block GA4 scripts from loading. If that’s the case, you may need to adjust your settings or whitelist analytics URLs.
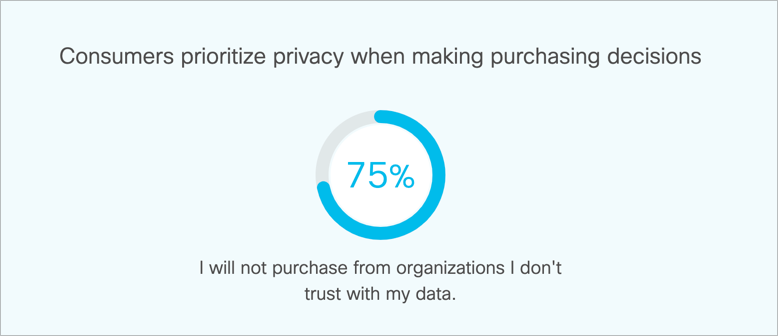
On top of that, cookie banners can cause issues too. In the EU and other regions with privacy laws, GA4 won’t track visitors unless they give explicit consent. If your site’s cookie setup is missing consent mode or isn’t firing the GA tag properly after someone accepts, it can look like traffic has dropped when it really hasn’t.
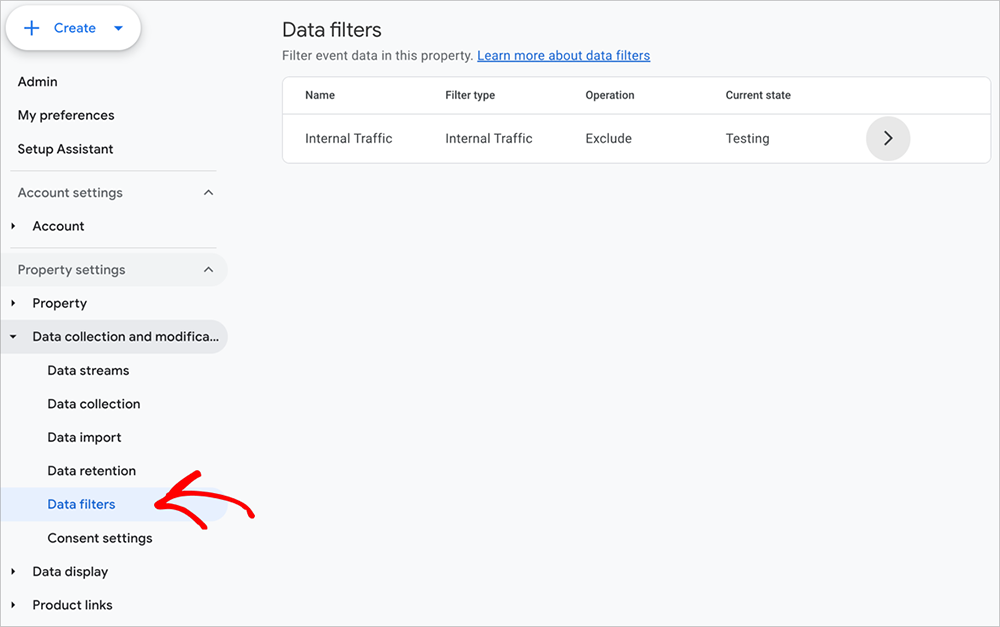
GA4 gives you the option to filter out certain types of traffic, like bots or internal visits. That’s helpful, but it can hide real data if something’s misconfigured.
I’ve seen this happen when someone sets up an IP exclusion and forgets they’re using a VPN or shared network. Suddenly, all their team’s visits disappear, and it looks like the site has gone silent.
After a high-profile data breach, Blue Shield of California tried to tighten up their tracking setup. In the process, they ended up filtering out more than they meant to.
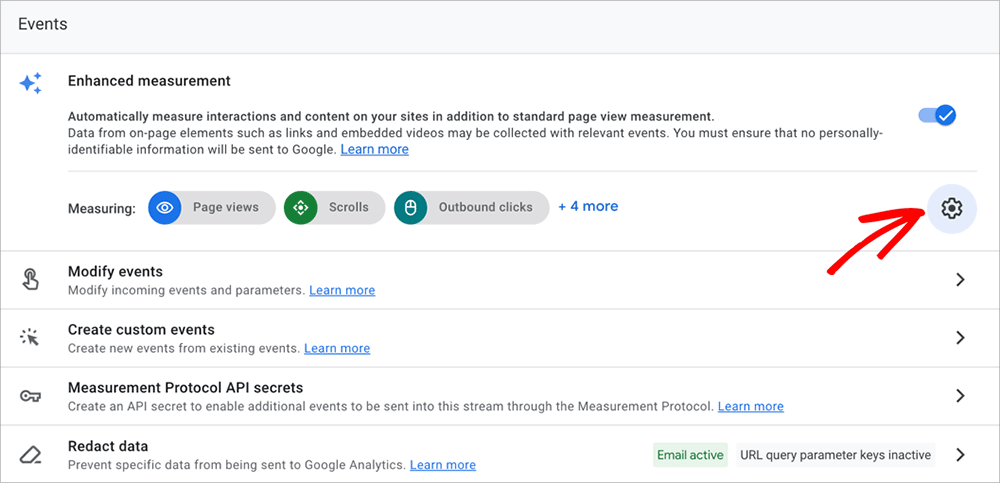
If your numbers look suspiciously low, check your filters. You can find them in GA4 under Admin » Data Settings » Data Filters.
Data Filters in GA4
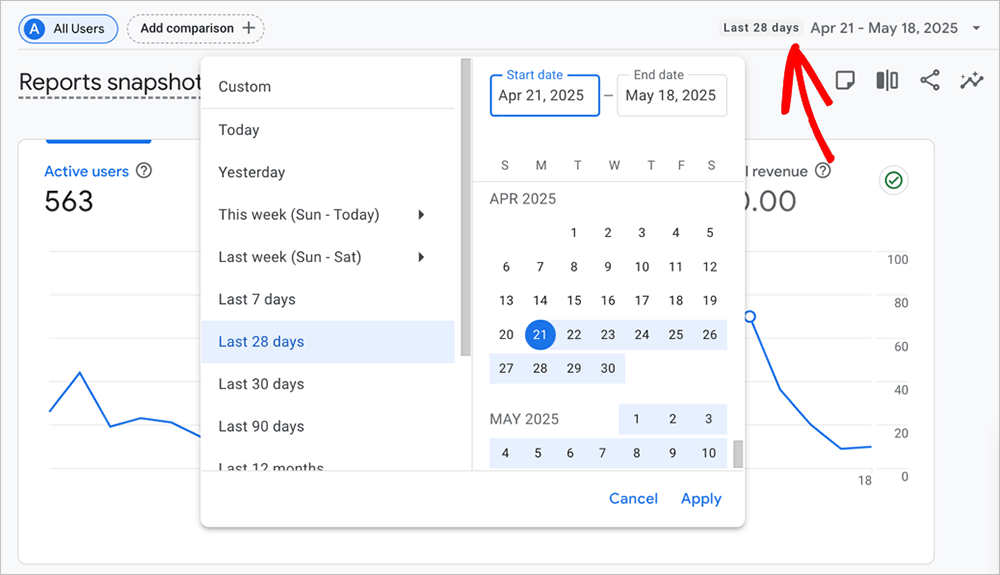
5. You’re Checking the Wrong Date Range
I’ve had friends message me in a panic because their traffic “disappeared,” only to find out they were looking at future dates or an empty time period by mistake.
It happens more often than you’d think. Maybe the calendar didn’t update. Maybe someone clicked a custom segment and forgot to clear it.
Before diving into deeper fixes, double-check your date range in the top-right corner of GA4. Make sure you’re viewing the right time period and that no filters are hiding your data.
Choosing a date range in Google Analytics
If everything looks right, but your numbers are still way off, the problem might not be with your setup. It could be that your events aren’t firing properly. Since GA4 is built around events, broken tracking can make your reports look completely empty.
GA4 Isn’t Tracking Events Properly
When GA4 stops showing conversions or other key actions, it’s usually an event issue. Here’s how I figure out what’s gone wrong.
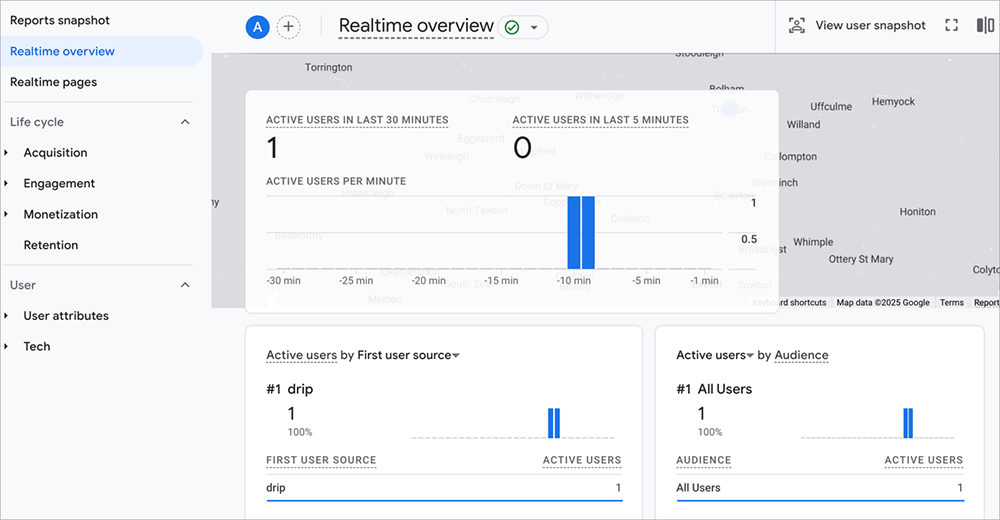
Realtime Report
This is the fastest way to check if your tracking is working. Go to Reports » Realtime and open your website in another browser tab. You should see at least one user appear, even if it’s just you.
GA4 Realtime Report
If the Realtime report stays blank while you’re visiting the site, something’s not connecting properly. Either the tracking code isn’t firing, or GA4 isn’t receiving the data.
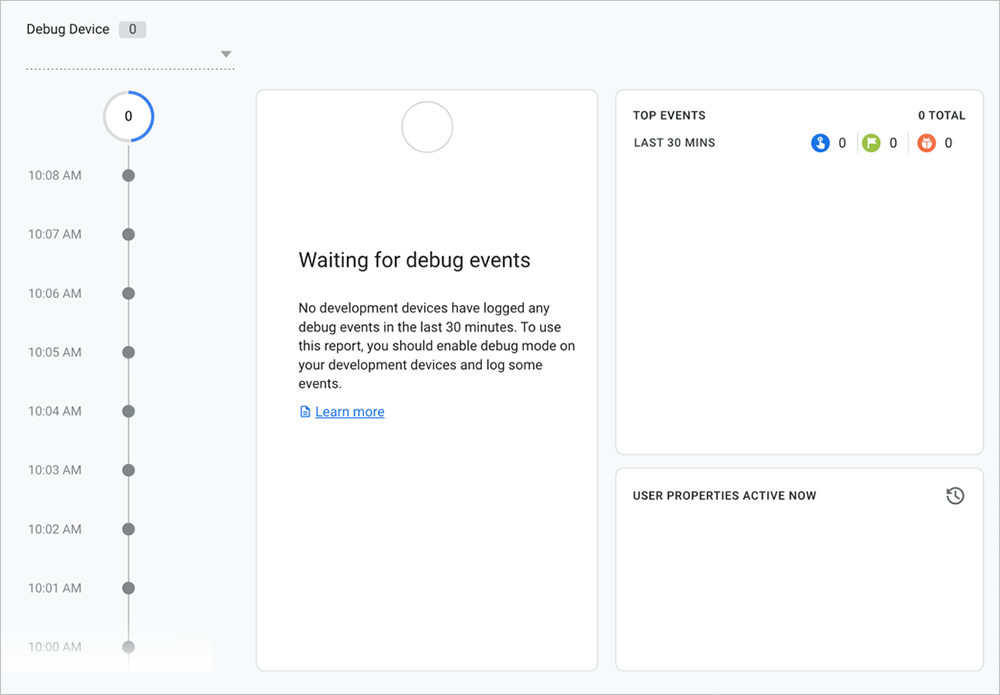
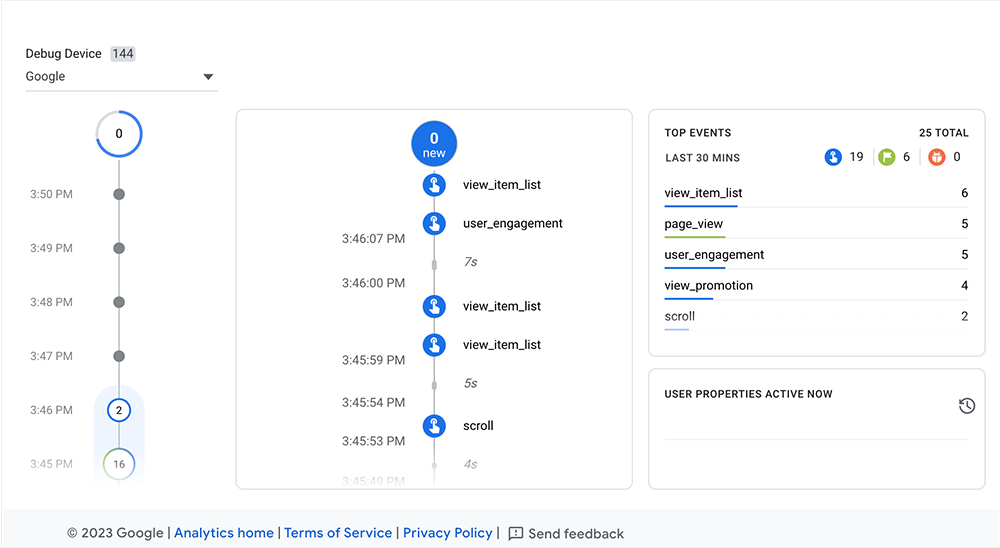
DebugView
If your Realtime report is empty, DebugView is the next place I check. It shows you exactly what GA4 is picking up in real time. That includes page views, scrolls, clicks, form submissions, and more.
To open it, go to Admin » DebugView in your GA4 account.
GA4 Debug View
To start seeing data, you’ll need to trigger a test session using debug mode. This lets GA4 know you’re actively testing and sends data to the DebugView panel.
Debug view panel in GA4
There are two simple ways to do this:
Google Tag Assistant is a free Chrome extension that helps you test your tracking setup. Once it’s installed, visit your website and it will show you which tags are active.
Google Tag Manager preview mode lets you test events before they go live. If you’re using Tag Manager to manage GA4, click Preview, follow the prompts, and interact with your site to start a session.
As you click around your site, you should see a live feed of events appear in DebugView. If nothing shows up, the tracking code might be missing, blocked, or not set up correctly. In Google Tag Manager, make sure your GA4 configuration tag is firing on all pages and is not limited by a faulty trigger.
This tool has helped me catch everything from typos in event names to form triggers that silently failed. I’ve also seen issues where the event tag was set up incorrectly and never fired at all.
Advanced Problems That Can Affect GA4 Tracking
Most tracking issues come from things like missing tags, filters, or cookie banners. But if you’ve already checked the basics and GA4 still isn’t working, here are a couple of less common problems that could be affecting your setup.
Server-Side Tagging Setups
If you’ve switched to server-side tagging, your tracking works a little differently. Instead of sending data straight from the browser to Google Analytics, it routes through your own server first. This setup can help with performance and privacy, but it also adds more steps to get things working correctly.
Server side tagging in Google Analytics
GA4 won’t receive any data unless your server is forwarding events properly. You’ll want to double-check that:
Your server container is connected to the right GA4 property
Your Measurement ID is included in the configuration
All your event tags are still firing from the server side
If something is missing, your reports might show zero users even though your site is getting traffic. Google Tag Manager’s server-side tagging guide walks through the full setup if you need help checking your configuration.
Google Analytics Property Suspensions
In rare cases, Google may suspend a GA4 property for violating its terms of service. This usually happens when personally identifiable information (PII) is sent to Analytics, which isn’t allowed.
If your tracking suddenly disappears, and you’ve ruled out every other issue, log into your Google Analytics account and check for any warning messages or suspension notices. You can also reach out to Google support if something looks off.
Why I Use OnePageGA to Track If GA4 Is Working
OnePagePA
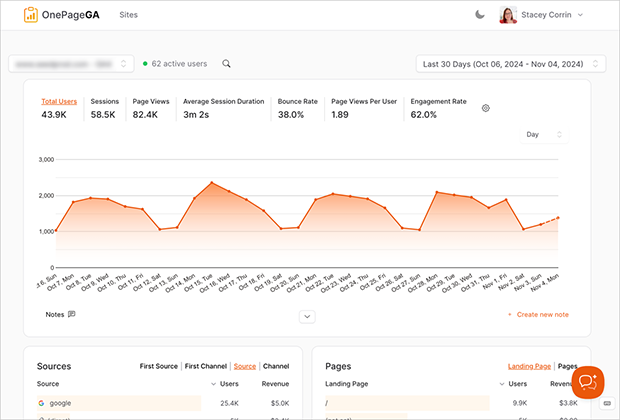
OnePageGA is a clean, beginner-friendly dashboard that connects to your GA4 account and shows all your key metrics in one place. It’s the easiest way I’ve found to spot tracking issues without digging through reports or switching between screens.
OnePageGA Dashboard
When I open it, I can quickly see:
Real-time sessions, bounce rate, and conversions
Which pages are getting the most traffic
Whether my key events are being recorded
Where visitors are coming from
Everything is laid out on one screen with no setup and no custom reports to build. It pulls the data straight from GA4 and organizes it in a way that actually makes sense.
One feature I rely on is annotations. I use them to leave notes when I launch a campaign, publish a new blog post, or update a landing page. For more details, you can see my guide on how to add annotations in Google Analytics.
Adding annotations in OnePageGA
Later, if my traffic changes, I can see exactly what happened that day without digging through my calendar or emails.
It also saves me time. If GA4 stops tracking, I can tell right away. I don’t have to guess whether something is broken or just slow. OnePageGA shows me what’s working and what needs attention.
FAQs About Google Analytics Not Working
Why is Google Analytics not working?
Most of the time, the issue is either your tracking code isn’t firing, you’re in the wrong GA4 property, or something is blocking the data like a cookie banner or ad blocker. Start with the Realtime report and DebugView to see if GA4 is picking up anything.
Why is my Google Analytics showing no data?
If GA4 was working before and now it’s not, check for recent changes. Look at your date range, tag settings, or any new filters that might be hiding your traffic. Even one small update can stop data from showing.
Why is Google Analytics showing 0 visits?
This usually means GA4 isn’t getting any tracking signals. It could be a script issue, a blocked tag, or a misconfigured setup. Try using Google Tag Assistant or preview mode in Tag Manager to see if anything is firing.
Why is Google Analytics not tracking our website?
If none of your events are being recorded, open DebugView and watch for live activity. Make sure your GA4 Measurement ID is correct and that your configuration tag is loading on every page.
Is Google Analytics still working?
Yes, GA4 is active and used on millions of sites. But it’s more complex than the older version. If you’re not seeing data, there’s likely a setup problem. I use OnePageGA to check everything in one place without needing to click through multiple reports.
Fix Google Analytics Not Working
When Google Analytics stops working, it’s stressful. Especially if you rely on it to track your traffic and conversions. The good news is that most problems come down to a simple setup issue, a blocked tag, or an event that isn’t firing correctly.
I’ve dealt with all of these on my own sites and learned exactly what to check and fix. Tools like Tag Assistant and DebugView can help, but they still take time to work through.
That’s why I use OnePageGA. It pulls all my GA4 data into one simple dashboard so I can see right away if something is broken or if everything’s running normally.
If you want a faster way to keep your tracking on track, start your free 14-day trial of OnePageGA. It’s the easiest way I’ve found to take the guesswork out of Google Analytics.
If you found this guide helpful, here are a few more resources that can help you get the most out of GA4:
How to Find Bounce Rate in Google Analytics 4 (Step-by-Step)
Posted on - Written By:
Stacey Corrin
Contents
The first time I opened GA4, I thought bounce rate was gone.
I was trying to figure out why one of my landing pages wasn’t converting. I went straight to where bounce rate used to live, but it wasn’t there. No column. No toggle. Nothing.
If you’ve had that moment of confusion too, you’re not imagining it. GA4 hides bounce rate by default, and it doesn’t work the same way it did in Universal Analytics.
In this guide, I’ll show you how to find bounce rate in GA4, how the new version works, and the faster way I check it now without customizing reports every time.
What Is Bounce Rate in GA4?
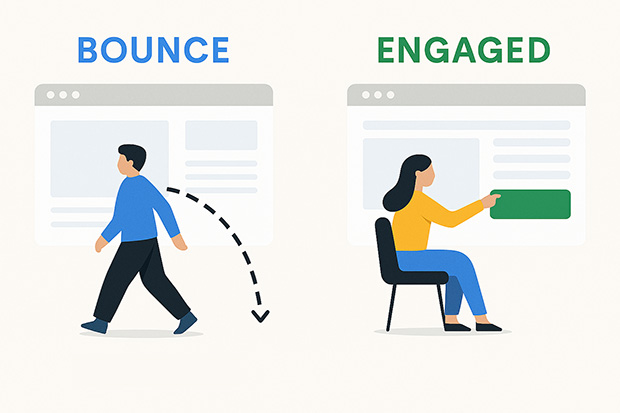
Bounce rate in GA4 works differently than it did in Universal Analytics. Instead of measuring how many people left your site without visiting another page, it now looks at engagement.
In GA4, bounce rate is the percentage of sessions that weren’t considered “engaged.” So a session counts as a bounce if the visitor:
Stays on your site for less than 10 seconds
Doesn’t trigger any conversion events
Views only one page or screen
If none of those things happen, GA4 marks the session as a bounce.
For example, let’s say someone lands on your homepage, scrolls a bit, but leaves after five seconds without clicking anything. That’s a bounce. But if they hang around longer, view another page, or submit a form, the session is marked as engaged and won’t count as a bounce.
Step-by-Step: How to Find Bounce Rate in GA4
GA4 doesn’t show bounce rate by default, so you’ll need to add it manually to your reports. You can add it in just a few clicks.
Step 1: Go to the Right Report
Log into your Google Analytics account, then go to Reports » Engagement » Pages and screens
GA4 pages and screens report
This is where you’ll see how individual pages are performing.
Step 2: Click the Edit Icon
In the top-right corner of the report, click the pencil icon to customize the report layout.
Customize GA4 pages and screens report
Step 3: Add Bounce Rate
In the panel on the right, look for the Metrics section. Click into it, then search for “Bounce rate.”
Add bounce rate metric to GA4 report
Once you see it, click to add it to the report.
Step 4: Apply and Save
Click Apply, then hit Save at the top of the page.
Save your customized GA4 report
Step 5: View and Explore Your Data
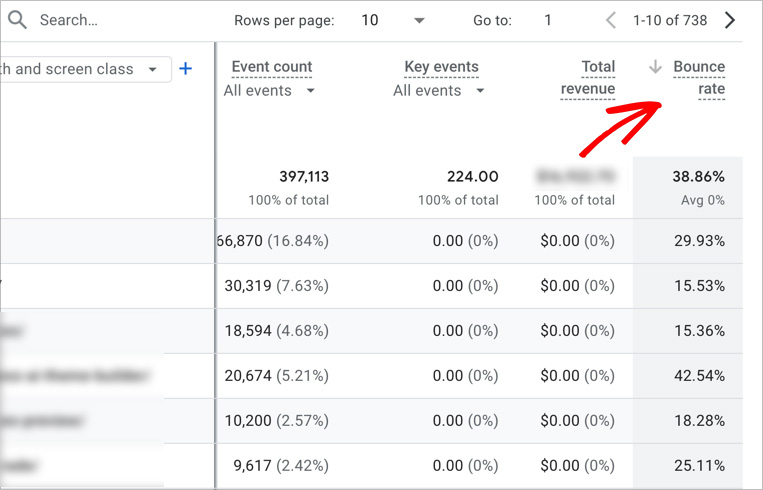
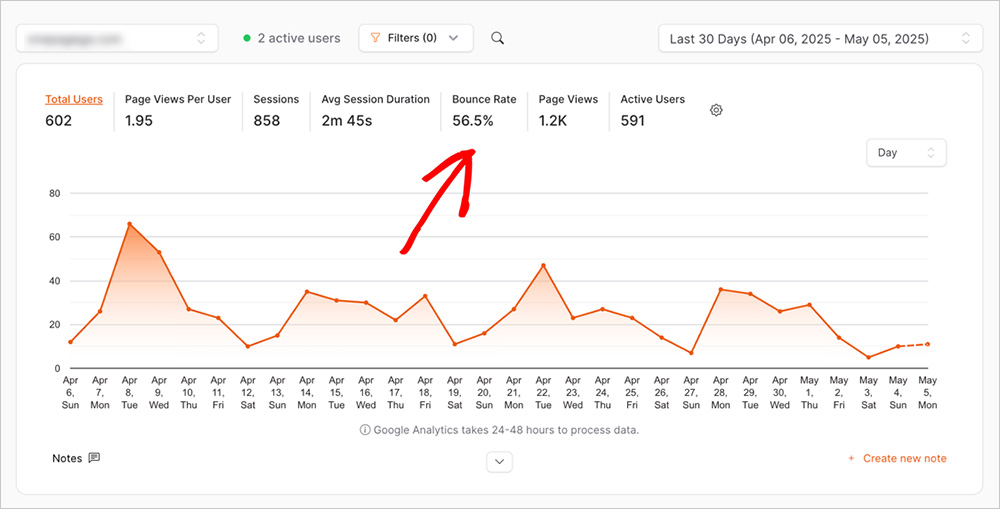
Now, scroll through the table to see the bounce rate for each page.
Click the Bounce rate column header to sort it from highest to lowest.
See your bounce rate in GA4
You can also click the + icon above the table to add a second dimension like traffic source, device type, or landing page path.
A Simpler Way: Track Bounce Rate with OnePageGA
GA4 makes it harder than it should be to find simple stats. That’s why I use OnePageGA to track my website analytics.
OnePageGA
It connects to your Google Analytics account and shows your key metrics on a single page, including bounce rate, with no need to edit reports or click through menus.
Bounce rate is included by default, right alongside sessions, users, conversions, and revenue.
How to find your GA4 bounce rate in OnePageGAitle
You can filter everything by:
Page
Source/medium
Campaign
Device
This makes it easy to spot pages with high bounce rates and start asking why. You might test a different layout or update your copy to keep people on the page longer.
With OnePageGA, there’s no need to change any settings or remember where to find things. All the key stats are waiting as soon as you log in.
Smart Ways to Use Bounce Rate in GA4
Bounce rate can be useful, but only if you know how to read it. A high number doesn’t always mean something’s wrong, and a low one doesn’t always mean everything’s working.
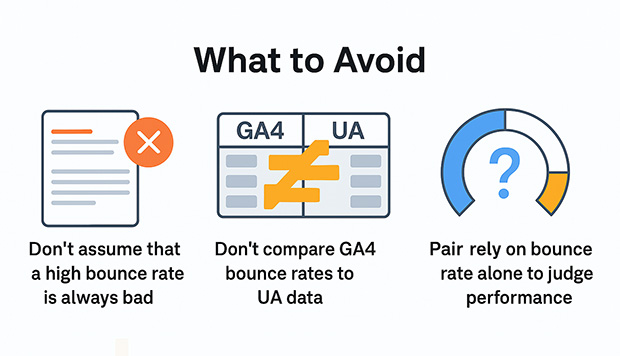
What to Avoid
Bounce rate mistakes to avoid
Don’t assume that a high bounce rate is always bad. Some pages are meant to be short visits, like a contact page or blog post. For example, blog posts often see bounce rates over 70%, which is considered normal in many industries.
Don’t compare GA4 bounce rates to your old Universal Analytics data. GA4 uses a completely different definition based on engagement, so the numbers won’t match.
Don’t rely on bounce rate alone to judge performance. It doesn’t tell you why someone left, just that they didn’t stay long or interact.
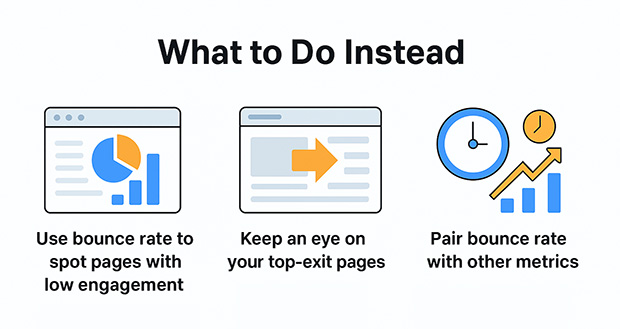
What to Do Instead
GA4 Bounce Rate tips
Use bounce rate to spot pages with low engagement. Pages with bounce rates over 70–80% and little conversion activity are worth a closer look.
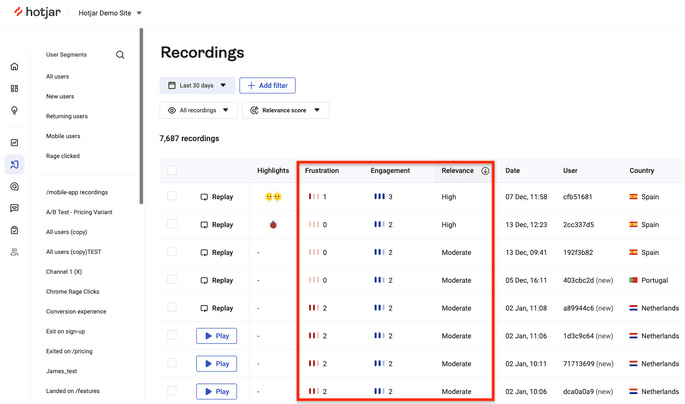
Keep an eye on your top-exit pages. If visitors are consistently leaving from a particular page, it might point to friction or confusion. According to Hotjar, high exit rates can be a sign that users didn’t find what they were looking for or hit a dead end.
Pair bounce rate with other metrics like time on page, scroll depth, and conversion rate. A low time on page and high bounce rate often means the content didn’t match what visitors were expecting.
Bounce rate is a starting point. It helps you spot red flags and test improvements. Most of all, it helps you ask better questions about how people are using your site.
FAQs About GA4 Bounce Rate
Why can’t I see bounce rate in GA4?
It’s not included by default. You have to manually add it to your reports using the customization options in the Pages and Screens report.
What’s a good bounce rate?
It depends on the type of content. Blog posts and news articles might have bounce rates over 70 percent, which is completely normal. Sales or product pages should usually aim for under 50 percent, especially if you want visitors to take action.
Is a high bounce rate always bad?
Not always. If someone reads a full blog post and then leaves, that counts as a bounce, but it might still be a successful visit. What matters is whether the page did what it was supposed to do.
Can I compare GA4 bounce rate with Universal Analytics?
No. The calculation is different, so the numbers won’t match. GA4 bounce rate is based on engagement, while Universal Analytics measured it based on single-page sessions. They track different behaviors.
Track Bounce Rate the Easy Way
Bounce rate didn’t disappear in GA4, but it is harder to find. You can still access it with a few quick steps, and once you know where to look, it’s easier to track over time.
That said, GA4 isn’t always the most user-friendly. If you want a faster way to check bounce rate and all your other key metrics in one place, OnePageGA can help.
8 Best eCommerce Analytics Tools for Online Stores (2025)
Posted on - Written By:
Stacey Corrin
Contents
When I first started working with analytics tools, I remember how overwhelming it felt. There was so much data, and I just wanted a clear answer to simple questions. Where are people coming from? What’s actually helping them buy?
Over time, I figured out which tools are helpful and which ones just add more confusion. That’s what I want to share with you here.
In this guide, I’m walking through the best ecommerce analytics tools I’ve tried myself. Some are simple. Some go deeper. But all of them can help you get a better handle on what’s really going on in your store.
Quick Summary of the Best eCommerce Analytics Tools
Tool
Key Features
Platforms
Free Plan
Best For
Google Analytics 4
Free, customizable reports, integrates with Google Ads
Web
Yes
General tracking and reporting
OnePageGA
Clean dashboard, note tracking, ecommerce-focused
Web (GA4 integration)
14-day trial
Beginners who want simple ecommerce insights
MonsterInsights
GA4 reports in WordPress, form and event tracking
WordPress
Yes (limited)
WooCommerce store owners
Mixpanel
Advanced funnels and retention, user segmentation
Web & mobile apps
Yes (up to 1M events)
Growing teams that need deeper analysis
Kissmetrics
Customer lifetime value, repeat purchase tracking
Web
No
Established stores focused on retention
Crazy Egg
Heatmaps, scrollmaps, click tracking
Web
30-day trial
UX improvements through visual behavior data
Hotjar
Session recordings, heatmaps, user feedback tools
Web
Yes (limited)
Understanding customer experience
Woopra
Customer journey tracking, user profiles, automation
Web
Yes (limited)
Tracking full customer lifecycle
How I Tested the Best eCommerce Analytics Tools
I didn’t put this list together by reading feature lists or copying what other blogs say. I actually spent time exploring each of these tools to see how they work in real life.
Here’s what I looked for:
Setup process: Was it quick, or did it feel like jumping through hoops?
Ease of use: Could I find the important stuff without clicking through ten menus?
Ecommerce-specific reports: Things like revenue, conversions, and cart activity.
Dashboard clarity: How easy it is to check stats at a glance.
Pricing and value: What you get on the free plan, and whether the paid versions are worth it.
I tested each tool from the perspective of someone running an online store, not a data analyst. My goal was to figure out which tools make it easier to understand what’s working and what needs fixing.
What Are eCommerce Analytics Tools?
eCommerce analytics tools help you track what’s happening in your online store. They collect data about your visitors, sales, and customer behavior, so you can see what’s working and what’s not.
Instead of guessing why your traffic dropped or which product is your top seller, these tools give you clear answers backed by real numbers.
Here’s the kind of data you can track:
Sales and revenue: See how much you’re making and where it’s coming from.
Traffic sources: Find out how people are discovering your store.
Conversion rates: See how many visitors actually buy something.
Cart abandonment: Spot where shoppers are dropping off before checkout.
Customer behavior: Track things like product views, clicks, and repeat orders.
When you have access to this kind of data, you can stop guessing and start making smarter decisions. You’ll know what to improve, what to promote, and where to focus your time and budget.
What to Look for in an eCommerce Analytics Tool
Not every analytics tool is made with online stores in mind. Some are built for general websites, while others focus on deep data that only developers care about. If you’re running an ecommerce business, you need something that gives you clear answers fast.
Here are a few things I look for when testing tools:
Easy setup: You shouldn’t need to touch code to get started.
Clear dashboards: Stats should be easy to read at a glance.
Ecommerce metrics: Look for tools that show revenue, orders, conversion rates, and cart behavior.
Platform compatibility: Make sure it works with your store (like Shopify, WooCommerce, or BigCommerce).
Marketing integrations: It’s a big help if the tool connects with your email or ad platforms.
Once you’ve covered the basics, a few extra features can give you deeper insights.
Heatmaps and session recordings show how people actually move through your site. A/B testing helps you try different layouts or buttons to see what gets better results. Funnel tracking shows where people drop off during checkout, and real-time data is great for spotting spikes during a sale or campaign.
With ecommerce sales expected to hit $7.4 trillion in 2025, it’s more important than ever to understand what’s happening in your store. The better your data, the easier it is to keep up and make smart decisions.
Best eCommerce Analytics Tools (Reviewed)
There are a lot of tools out there claiming to help you track your store’s performance, but not all of them are built with ecommerce in mind. I’ve tested each of the tools below myself to see how well they actually work, what they’re like to use, and whether they’re worth your time.
Let’s start with one you’ve probably already heard of, Google Analytics 4.
Google Analytics 4 (GA4) is the new standard for tracking website data, but it’s not exactly beginner-friendly. I’ve used it across several projects, and while it’s powerful, it takes some time to get used to, especially if you’re trying to track ecommerce data like product views, add-to-carts, and purchases.
My Experience
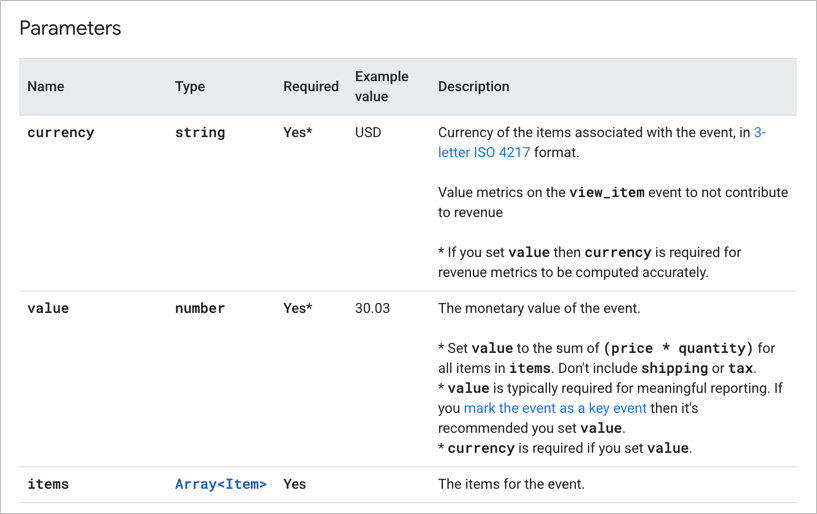
Setting up GA4 wasn’t the easiest. You have to manually create events to track things like revenue or checkout steps, and there’s a learning curve if you’ve never used it before.
GA4 custom event
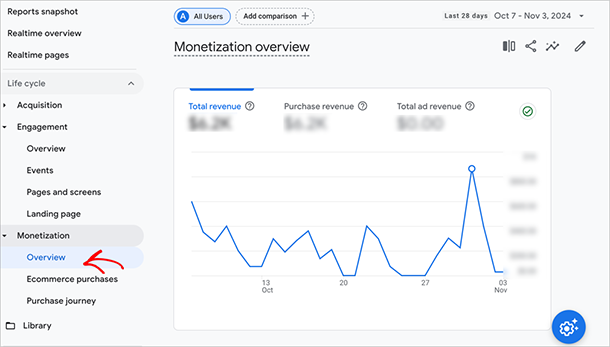
Once it’s set up, though, the reporting is detailed and really useful. I liked the Monetization reports, especially when I needed to see how individual products were performing over time.
GA34 Monteization report
One thing that helped was using Google’s own documentation, but I still found myself going back and forth a lot just to figure out how to build a simple ecommerce report.
Pros:
Free to use, even with advanced features
Really detailed reports once you know where to look
Works well with Google Ads and other Google tools
Cons:
Steep learning curve for new users
Setup is manual and takes time to get right
Some reports feel buried under too many clicks
Pricing & Plans
Google Analytics 4 is completely free, which makes it a popular choice for a lot of ecommerce stores. There’s a paid version called GA360, but most smaller stores won’t need it.
My Review
GA4 is a great tool if you’ve got the time (and patience) to learn how it works. It’s packed with features and works for just about any kind of store. But if you’re brand new to analytics or short on time, you might want to pair it with a simpler tool that makes the data easier to understand.
OnePageGA is a simple, beginner-friendly dashboard that pulls your Google Analytics data into one clean, easy-to-read screen. I started using it because I was tired of digging through GA4 to find the info I actually needed, like where sales were coming from or which pages were performing best.
My Experience
The setup was super quick. I just connected my Google account and the dashboard was ready in seconds. No settings to configure and no custom events to set up.
OnePageGA analytics dashboard
Everything was already organized in a way that made sense for ecommerce. I could see traffic, conversions, top pages, and revenue all in one place.
OnePageGA sources report
One thing I really liked is how easy it is to spot patterns. If I ran a promo or changed something on a product page, I could quickly see if it made a difference in traffic or sales.
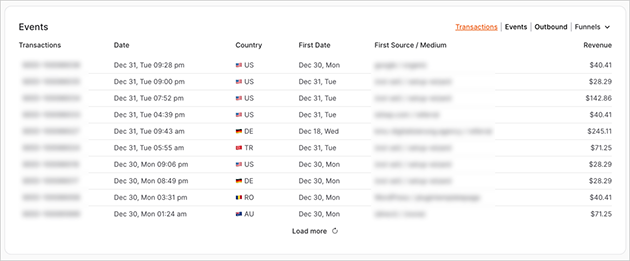
eCommerce transactions in OnePageGA
There’s also a built-in way to add notes, which makes it easy to keep track of changes without digging through old messages or emails.
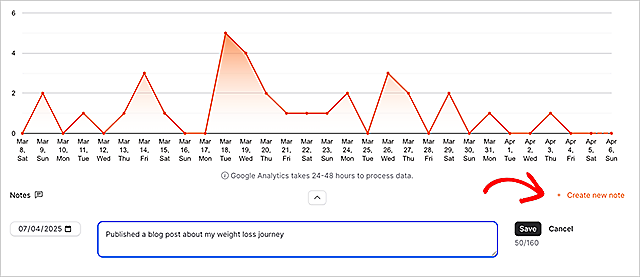
Adding annotations in OnePageGA
Pros:
Fast and easy to set up
Can easily see ecommerce data
Lets you add notes to explain traffic spikes or drops
Great if you want a clearer view of your GA4 reports
Includes conversion funnel tracking
Cons:
Only works with GA4 data
Pricing & Plans
You can try OnePageGA free for 14 days. After that, pricing starts at $9 per month, which is affordable if you want something easier than GA4.
My Review
If GA4 feels too complicated, OnePageGA is a great way to get the data you care about without the hassle. I like using it when I want quick answers and a clean view of what’s working. It’s ideal for solo store owners or small teams who don’t need a full-blown analytics setup.
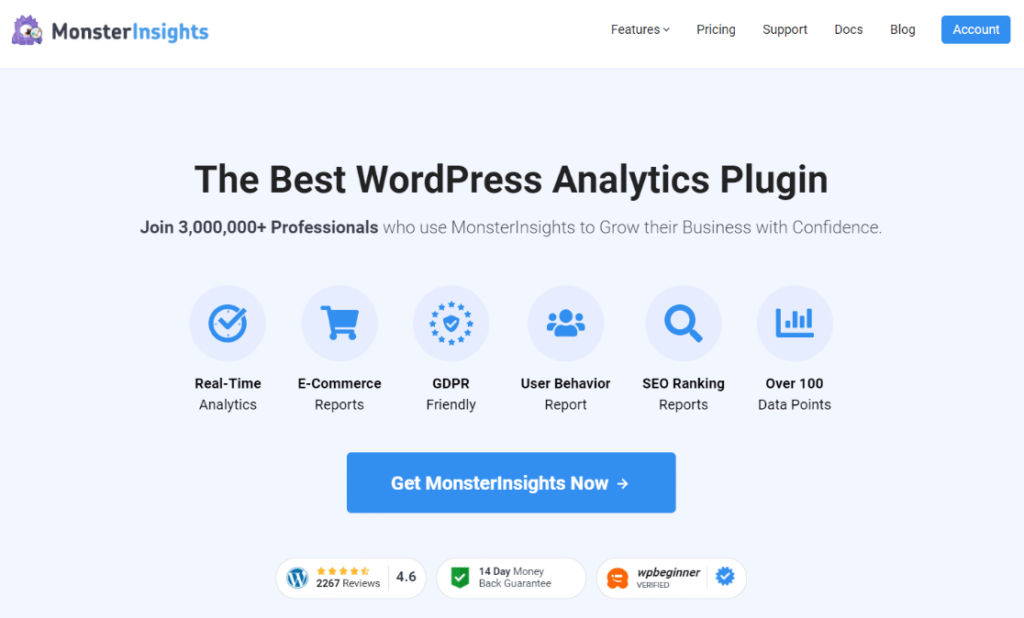
MonsterInsights is a WordPress plugin that makes Google Analytics a lot easier to understand, especially if you’re using WooCommerce. I’ve used it on several WordPress sites where I wanted to skip the GA4 setup headache and just see the numbers that matter, right inside the WordPress dashboard.
My Experience
Setting up Google Analytics was straightforward. I installed the plugin, connected my Google account, and right away I could see reports without needing to open GA4. It pulled in ecommerce data like revenue, conversion rate, and top products, which saved me a lot of clicks.
MonsterInsights eCommerce report
What I liked most was being able to view key metrics on the WordPress dashboard without jumping between tools. That said, you still need to have Google Analytics running in the background.
MonsterInsights doesn’t track data on its own. It just makes GA4 easier to use, especially if you’re not confident navigating the default reports.
Pros:
Beginner-friendly setup inside WordPress
Shows GA4 ecommerce data without leaving your site
Works well with WooCommerce
Lets you track clicks, forms, and custom events with no code
Cons:
Requires GA4 to work, it’s not a standalone analytics tool
Some features, like advanced reports, are locked behind the paid version
Pricing & Plans
There’s a free version with basic tracking, which is great for simple stores. If you want ecommerce tracking, though, you’ll need the Pro plan, which starts at $199.50 per year.
My Review
If you use WordPress and want your GA4 data to be easier to access, MonsterInsights is a great option. I recommend it for WooCommerce stores in particular. Just keep in mind that it depends on GA4 behind the scenes, so you’ll still need to set that up first.
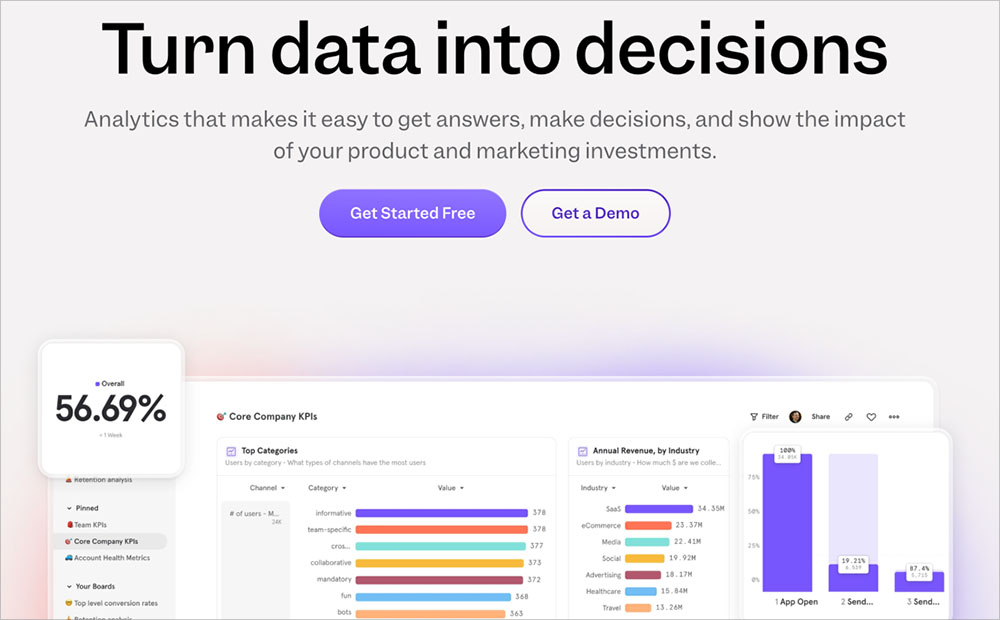
Mixpanel is more advanced than the other tools I’ve covered so far. It’s designed for businesses that want to track detailed customer behavior, not just pageviews and traffic sources.
I’ve used it on projects where we needed to follow what users were doing after landing on the site, like how many people clicked certain buttons or dropped off during signup.
My Experience
Right away, I could tell Mixpanel wasn’t built for beginners. The setup took more time, and I had to plan out which events I wanted to track. But once that part was done, the reports were incredibly detailed. I could build funnels, compare user segments, and even track what actions led to higher customer lifetime value.
Mixpanel funnels report
What stood out the most was the level of flexibility. I could create custom reports based on very specific behavior, like which blog posts led to purchases or how long someone stayed before converting.
It’s not the tool I’d recommend for your first store, but it’s great for bigger teams or stores that are scaling.
Pros:
Very detailed event-based tracking
Great for funnel analysis and customer retention reports
Lets you create custom dashboards and compare segments
Works for web and mobile apps
Cons:
Steeper learning curve compared to beginner tools
Takes more time to set up and configure
Can feel like overkill for small or new stores
Pricing & Plans
Mixpanel has a free plan that gives you up to 1 million monthly events, which is more than enough for most small stores. Paid plans start at $.00028 per event after the free cap.
My Review
Mixpanel is a solid choice if you’ve outgrown basic analytics and want to understand exactly how people use your store. I’d recommend it for growing ecommerce businesses with more complex sales journeys, or teams that want deeper data to make decisions.
Kissmetrics is built specifically for ecommerce, which makes it a little different from general analytics tools like GA4. I tried it on a test store to see how it handled things like customer lifetime value and repeat purchases, areas where GA4 tends to fall short without extra setup.
My Experience
The first thing I noticed is that Kissmetrics focuses more on people than sessions. Instead of just tracking visits or clicks, it builds a profile around each user, so you can see their full journey, from the first visit to their most recent order.
It was really useful for understanding how often customers came back, how long it took them to buy, and what they bought next. The dashboard isn’t flashy, but the data is actionable. I could easily track metrics like revenue by traffic source or which campaigns brought in the most loyal customers.
Kissmetrics executive dashboard
Setup wasn’t instant, and it works best if you have a developer who can help you add custom events. But once it’s in place, it’s a great tool for stores that want to grow based on customer behavior, not just traffic spikes.
Pros:
Built specifically for ecommerce businesses
Tracks customer lifetime value, repeat purchases, and full user journeys
Great for segmenting users and tracking retention
Offers reports GA4 doesn’t handle well without customization
Cons:
Not as beginner-friendly as some tools
Requires more setup and possibly developer help
More expensive than some other platforms
Pricing & Plans
Kissmetrics doesn’t have a free plan. Pricing starts around $299 per month, so it’s more suited to established stores that are ready to invest in long-term growth.
My Review
Kissmetrics is a powerful eCommerce analytics tool if you’re focused on customer retention and long-term value. It’s probably not the first analytics tool you’ll use, but it’s a strong option once you’re ready to go deeper. I’d recommend it for growing or established stores that want more than just traffic data.
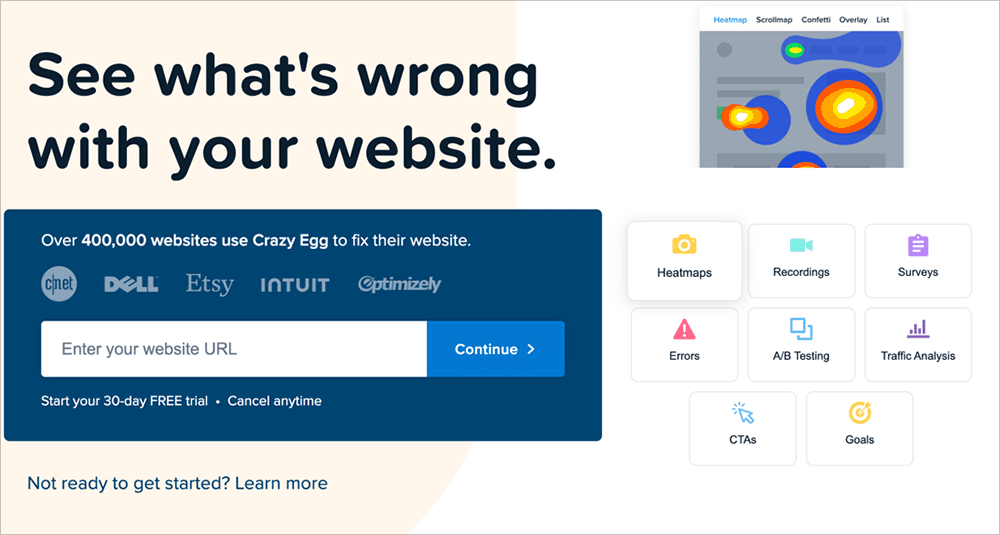
Crazy Egg is a behavior analytics tool that shows you exactly how people interact with your website. I’ve used it when I wanted to go beyond the numbers and actually see what visitors were doing. For example, where they clicked, how far they scrolled, and what they ignored completely.
My Experience
Setting it up was simple. I added a small tracking script to the site, and within a few hours, I could start viewing heatmaps and scrollmaps. The heatmaps were especially helpful for spotting dead zones, parts of a product page that weren’t getting any attention, and figuring out which buttons or sections people were actually using.
One of my favorite features was the ability to compare desktop and mobile behavior. It helped me fix a few design issues that were hurting mobile conversions without me even realizing it.
Crazy Egg desktop and mobile heatmaps
Crazy Egg doesn’t give you traffic or revenue numbers like GA4 or OnePageGA, but it’s a great companion tool for understanding what your visitors are doing once they land on your site.
Pros:
Easy to set up and start using right away
Heatmaps, scrollmaps, and click tracking Great for spotting user experience issues
Helpful mobile vs desktop comparison
Cons:
Doesn’t track sales or traffic, it’s a behavior layer only
Works best alongside a standard analytics tool
Pricing & Plans
Crazy Egg offers a 30-day free trial. Paid plans start at $29 per month and scale based on your traffic and pageviews.
My Review
Crazy Egg is a great add-on if you want to understand how people are actually using your store. I’d recommend it for store owners who are focused on improving their site’s layout or boosting conversions through design changes. It won’t replace your main analytics tool, but it adds insights you can’t get from numbers alone.
Hotjar is similar to Crazy Egg, but it comes with a few extra features that make it even more useful for ecommerce. I’ve used it when I wanted to see how visitors were using a site in real time and get direct feedback through surveys or feedback widgets.
My Experience
It only took a few minutes to set up. Just drop the tracking code on your site and it starts collecting data right away. The session recordings were the standout feature for me. I could watch real visitor sessions, see where people got stuck, and figure out why they were leaving certain pages.
Hotjar session recordings
Hotjar also lets you add surveys or quick questions on your pages. I’ve used these to ask things like “Was this page helpful?” or “What stopped you from checking out?” The responses gave me ideas I wouldn’t have thought of just by looking at analytics reports.
Compared to Crazy Egg, Hotjar feels a bit more all-in-one. You still don’t get full traffic or revenue reporting, but it gives you a lot of insight into what your customers are doing and thinking.
Pros:
Session recordings, heatmaps, and scroll tracking
On-page surveys and feedback widgets
Easy setup and clean interface
Great for finding UX issues and improving conversion rates
Cons:
Doesn’t include ecommerce metrics like revenue or AOV
Recordings can take time to review manually
Best used with another analytics tool for the full picture
Pricing & Plans
Hotjar has a free plan that includes heatmaps and basic session recordings. Paid plans start at $32 per month if you want access to more recordings, surveys, and user feedback tools.
My Review
Hotjar is one of my go-to tools when I want to understand what’s getting in the way of a sale. It’s especially useful for improving product pages, checkout flows, and mobile layouts. I recommend it for any store that wants real-world insight into how visitors behave, not just what they clicked.
Woopra is a customer journey analytics tool that focuses on tracking the full lifecycle of your users, from first visit to final purchase and beyond. I tested it out to see how well it handled ecommerce funnels and repeat customer behavior, and it surprised me with how much detail it offers.
My Experience
Woopra took a bit more time to set up than tools like OnePageGA or MonsterInsights, but once it was connected, I could see individual user journeys in a way most tools don’t offer. It gave me a clear view of how people moved through the store, what brought them in, what they clicked, and what made them convert or leave.
Woopra analytics report
It also let me build custom funnels and retention reports without needing any code. That part was especially helpful for spotting where returning customers were dropping off or which products led to second purchases.
Woopra feels like a mix between a standard analytics tool and a lightweight CRM. You can track behavior, but also dig into user profiles and automate follow-ups based on what someone did or didn’t do on your site.
Pros:
Tracks the full customer journey from first visit to repeat purchase
Powerful funnel and retention reporting
User profiles and segmentation built in
Integrates with tools like Shopify, HubSpot, and Mailchimp
Cons:
Setup takes longer than beginner tools
Interface can feel overwhelming at first
Free plan is limited for ecommerce use
Pricing & Plans
Woopra has a free plan with basic features, but you’ll need a paid plan for deeper ecommerce tracking and automation. Pricing starts at $49 per month, which makes it better suited for growing or mid-sized businesses.
My Review
Woopra is a solid choice if you want more than just traffic data. It’s built to help you understand how people move through your store and where you’re losing or keeping customers. I’d recommend it for teams that are ready to dig deeper into lifecycle tracking and want to tie analytics to their marketing efforts.
Important Metrics to Track (No Matter What Tool You Use)
It doesn’t matter which analytics tool you choose. The most important thing is knowing what to look at. Here are a few key ecommerce metrics I always keep an eye on, no matter what platform I’m using.
Metric
Why It Matters
Conversion Rate
Shows how many visitors actually buy something. Low rates often mean something on your site needs fixing.
Customer Lifetime Value (CLV)
Tells you how much a customer is worth over time, helping you decide how much you can spend to keep them.
Average Order Value (AOV)
Measures how much people spend per order. Useful for boosting revenue without increasing traffic.
Traffic Sources
Helps you see which marketing channels bring in valuable visitors, so you can focus on what works.
Product Performance
Lets you track which products are doing well and which might need improvement or promotion.
Abandonment Rate
Shows how many people leave before completing checkout. High rates usually point to a problem in your funnel.
Best for beginners:OnePageGA If you want something simple that shows you the numbers that actually matter, OnePageGA is a great place to start. The setup is quick and the dashboard is easy to understand.
Best for behavior tracking:Hotjar Hotjar is my go-to when I want to see how people are actually using a site, not just where they came from. It’s great for improving layouts and spotting friction.
Best free option:Google Analytics 4 GA4 is packed with features, and it doesn’t cost anything to use. Just be ready to spend a little time learning how to get the most from it.
FAQs
What is the most popular ecommerce analytics tool?
Google Analytics 4 is the most widely used tool, mostly because it’s free and connects easily with other Google products. But popular doesn’t always mean easiest. Many store owners prefer to use it alongside a simpler tool.
What’s the best free ecommerce analytics tool?
GA4 is your best bet if you want something free with powerful features. Just be prepared for a bit of a learning curve. If you want something easier, OnePageGA offers a free trial and is much quicker to get started with.
Can I use more than one tool at once?
Yes, and in many cases, you should. For example, you might use GA4 for tracking and Hotjar to understand behavior. Combining tools gives you a fuller picture of what’s going on.
How do I choose the right tool for my store?
Start by thinking about what kind of info you actually want. If you just want to see where sales come from, go with something simple like OnePageGA. If you need to track funnels or customer retention, you might need a tool like Mixpanel or Woopra.
Do I need analytics if I’m just starting out?
Yes, even if you’re only getting a few visitors a day, it’s helpful to know where they’re coming from and what they’re doing. That way, you can fix small problems early and grow smarter as traffic increases.
Final Thoughts on Ecommerce Analytics Tools
There’s no perfect analytics tool that works for everyone. The best one is the one you’ll actually use. Whether you want a quick snapshot of your sales or deep insights into customer behavior, there’s something on this list that can help.
Start simple with something like OnePageGA, get comfortable with the basics, and build from there. The more you understand your data, the easier it becomes to make decisions that actually grow your store.
Want to get better at tracking and understanding your store’s data? Here are a few helpful guides:
How to Add Annotations in Google Analytics 4 (Quick & Easy)
Posted on - Written By:
Stacey Corrin
Contents
When I started using Google Analytics to track my website, I often wished I could mark important changes on my reports. Like when I redesigned my homepage or started a new ad campaign, I’d see a big jump in traffic but couldn’t remember what caused it.
That’s when I found out about notes in Google Analytics. They’re called annotations, and they make a big difference. I run several WordPress sites, and adding these notes right on my reports helps me see what’s working and why my traffic goes up or down.
In this guide, I’ll show you how to add annotations in Google Analytics. It’s easy, only takes a minute, and you don’t need any special tech skills.
What Are Annotations in Google Analytics?
Annotations are simple notes you can add to your Google Analytics reports. They’re tied to a specific date and show up just below your traffic charts. Think of them like sticky notes for your data—helpful reminders of what happened and when.
You can use annotations to track things like:
When you launched a new marketing campaign
Website updates, like a redesign or new feature
Big events in your industry that might affect traffic
Google algorithm updates
If you work with a team, annotations are also a great way to keep everyone on the same page. Instead of guessing why traffic went up or down, your team can just check the notes.
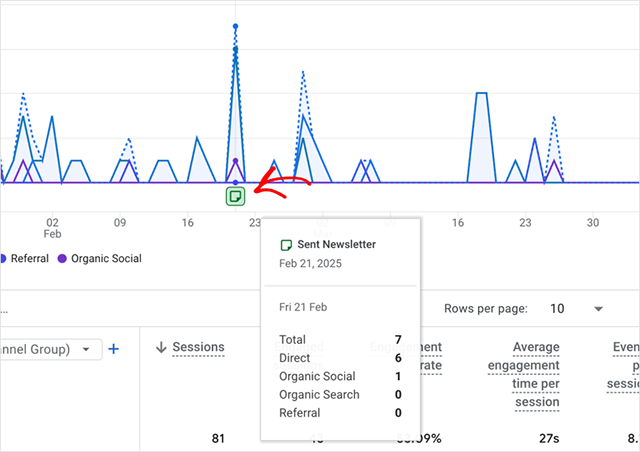
For me, annotations have been a huge help. A few months ago, I saw a big spike in traffic on one of my sites and couldn’t figure out why.
Then I looked at my annotation. I had added a note that day saying I sent out a newsletter.
GA4 annoation example
That reminder saved me a lot of time trying to figure it out.
The Basics of Adding Annotations in GA4
In Google Analytics 4, annotations work a bit differently than they did in the older version. They’re still simple to use, but there are a few things you should know.
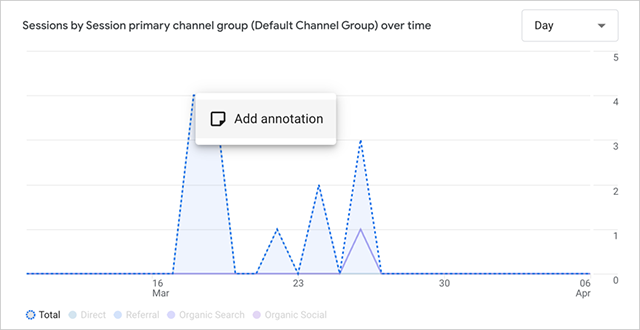
To add an annotation, just right-click on a data point in one of your reports. A small menu will pop up, and you can choose “Add annotation.” You can learn more in Google’s official help guide.
Add an annotation in GA4
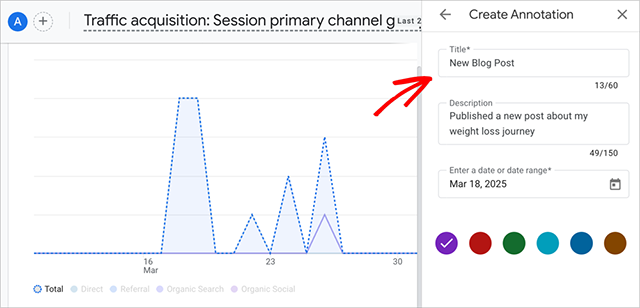
From there, you’ll be able to fill in the details:
A short title
A longer description if you want to explain more
The date or date range
A color to help you spot it quickly
Add annotation description in GA4
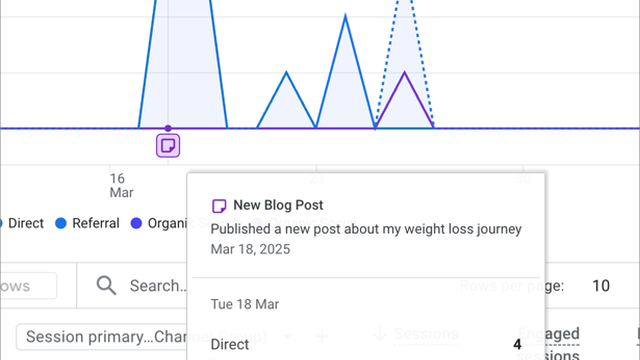
After you save a note, it’s visible across all reports that use line graphs. It’s an easy way to keep track of changes without digging through your calendar or email.
View an annotation in GA4
There are, however, a few limits to keep in mind:
You need to have Editor access or higher to add annotations
Each GA4 property can hold up to 1000 annotations
Annotations only show up on reports with line graphs
Even with these limits, I’ve found that using annotations this way makes it much easier to stay organized, especially when managing multiple sites or campaigns.
There are also Chrome extensions that let you add annotations to GA4, like Crystal Ball, but I prefer using built-in tools. It keeps things simple and reliable.
Adding Annotations with OnePageGA
If you’ve ever felt overwhelmed trying to make sense of GA4 reports, you’re not alone. That’s exactly why I started using OnePageGA.
OnePageGA Homepage
It’s a simple, user-friendly dashboard that shows all your key metrics in one place. You can finally understand what’s happening on your website without clicking through different reports.
One of my favorite features is how easy it is to add annotations. You don’t need to right-click or scroll through menus. OnePageGA makes it a one-step process, right at the top of your dashboard.
All you have to do is click + Create new note, pick a date, add your note, and click Save.
Add an annotation to GA4 in OnePageGA
That’s it.
View GA4 annotation in OnePageGA
Compared to GA4’s multi-step process, this is much quicker and easier. And once your note is added, it appears across all your metrics, so you can immediately see how that change impacted your traffic.
Best Practices for Using Annotations in GA4
Once you start using annotations in GA4, it’s easy to forget just how helpful they can be. Here are a few tips I’ve picked up that make them even more useful:
Keep your notes short and clear. A few words are usually enough to jog your memory.
Use consistent colors. For example, green for campaigns, red for site issues, and blue for blog posts.
Add notes right away. It’s easy to forget details later, so I try to add a note the same day something happens.
Stick to meaningful events. Focus on changes that could impact your traffic, like marketing pushes or site updates.
Review your notes regularly. They’re a great way to spot patterns or figure out what’s working.
These small habits can help you get even more value from your reports.
Frequently Asked Questions
Are annotations visible to everyone?
Any user who has access to the GA4 property can see the annotations. It’s a great way to keep your team on the same page.
Can I edit or delete an annotation?
Just click on the annotation you added, and you’ll see options to update or delete it.
Why can’t I see my annotation?
Annotations only show up on line graph reports in GA4. If you’re looking at a different type of report, the note won’t appear.
Can I use other tools to track changes in my analytics?
Some people use tools like Google Sheets or Looker Studio to track changes alongside their website data. While those options can work, they often take more time to set up and manage. I’ve found that built-in annotations in GA4, or even better, the one-click notes in OnePageGA, are much faster and easier to use.
Final Thoughts on Using Annotations
Annotations are a simple way to connect changes on your site with your traffic data. While GA4 now includes this feature, the process is still a bit clunky and limited to certain reports.
With OnePageGA, adding notes is much quicker. You can add an annotation in one step, and it shows up across all your key metrics. It’s faster, easier to manage, and a lot more beginner-friendly.
If you’re looking for a better way to understand your website data, I recommend giving OnePageGA a try. You can start with a 14-day free trial and see how much easier it is to track what’s working on your site.
If you found this guide helpful, here are a few more articles to help you get the most out of Google Analytics:
4 Types of Events in Google Analytics + How to Use Them
Posted on - Written By:
Stacey Corrin
Contents
When I started using Google Analytics 4, I had no idea what I was looking at. All the event tracking options were new to me, and I felt lost trying to figure out what to track on my website.
I spent months learning GA4 the hard way, through trial and error on my own sites and by helping other website owners set up their tracking. Now I know exactly which events you need to watch and which ones don’t matter for your website’s growth.
That’s why I put together this simple guide to GA4 events. You’ll learn what each event means and how it can help you grow your website. Don’t worry if you’re new to analytics or just moving to GA4 – I’ll walk you through everything step by step.
What Are Events in Google Analytics?
GA4 events are like a visitor’s digital footprint on your website. While a pageview just tells you someone looked at a page, events show you exactly what they did there, like clicking a button, watching a video, or filling out a form.
In the old Universal Analytics, we had to set up different types of “hits” like pageviews, events, and transactions separately. But GA4 makes things simpler by treating everything as an event, even basic actions like when someone views a page or starts a new session on your site.
I learned this lesson the hard way with my first online store. When I only tracked pageviews, I couldn’t figure out why people weren’t buying. Once I started tracking events like “add to cart” clicks and form abandonments, I knew where customers were getting stuck and could fix those issues.
Types of Events in Google Analytics 4
Now that you understand what events are, let’s look at the four main types of events in GA4. Each type serves a different purpose, and knowing when to use each one will help you track exactly what matters for your website.
These are the events GA4 tracks for you right out of the box. You don’t need to set up anything, as they start working as soon as you add the GA4 tracking code to your website.
In my experience, automatic events give you a good base level of data about how people use your site. For example, GA4 automatically tracks when someone starts a new session, clicks on a file download, or scrolls down your page.
Automatically collected events in GA4
Here are the most useful automatic events I rely on:
session_start: Tells you when a new viewing session begins
page_view: Records each time someone looks at a page
user_engagement: Shows if visitors are actually engaging with your content
file_download: Tracks when someone downloads your files
2. Enhanced Measurement Events
Enhanced Measurement events are a step up from automatic events, but they’re still easy to use. Think of them as bonus tracking features you can turn on with just one click in your GA4 settings.
I use these events on most sites I manage because they tell me more about how visitors interact with specific parts of my pages. For example, I can see if people are watching my videos or clicking on outbound links to other websites.
Enhanced measurements events in GA4
Here’s what Enhanced Measurement can track for you:
Scroll tracking: Shows how far people scroll down your pages
Outbound clicks: Records when visitors click links to other websites
Site search: Tracks what people look for using your website’s search box (but only if your site uses standard search URLs with query parameters like “?s=” or “?search=”)
Video engagement: Measures if people play, pause, or finish watching your videos
Form interactions: Shows when visitors start filling out your forms
To turn these on, you just need to visit your GA4 settings and check a few boxes. I’ll show you exactly how to do this in the setup section later.
3. Recommended Events
These are events that Google suggests you set up based on what kind of website you have. Unlike automatic events, you’ll need to add some code to track these, but Google provides clear guidelines on how to set them up.
For example, here are the parameters Google suggests using for the add-to-cart event:
Add-to-cart event parameters for GA4
I started using recommended events when I noticed gaps in my tracking data. For example, on my online store, I wanted to know more than just my final sales, I needed to see the whole buying journey.
Recommended events helped me track things like when people viewed products or added items to their cart.
Here are some popular recommended events I often use:
sign_up: Tracks when someone creates a new account
purchase: Records when someone buys something
generate_lead: Shows when someone fills out a contact form
view_item: Tracks when someone looks at a product
add_to_cart: Records when items are added to shopping carts
The nice thing about using recommended events is that they work with GA4’s built-in reports and tools. This means you’ll see your data in the right places without extra setup.
4. Custom Events
Custom events are like building your own tracking system. When the automatic, enhanced, and recommended events don’t track exactly what you need, that’s when custom events come in handy.
On my blog, I wanted to know when people clicked on specific buttons or reached certain spots in my articles. These weren’t actions GA4 tracked automatically, so I created custom events. While this takes more work to set up, it gives you the exact data you need.
Some useful custom events I’ve created include:
Reading progress (25%, 50%, 75% of an article)
Newsletter popup interactions
CTA clicks on landing pages (as seen in the screenshot below)
Time spent on pricing tables
PDF document views
Custom CTA event in GA4 report
Just remember to keep your custom event names simple and consistent. I learned this the hard way – messy event names make it really hard to find the data you need later.
Setting Up and Tracking Events in GA4
When I first set up event tracking on my own website, I was overwhelmed by all the options. But after learning GA4 and seeing what actually matters for growing my site, I can now show you the simplest way to get started.
The first thing you’ll need is a GA4 property and your tracking code installed on your website. If you haven’t done this yet, check out my guide on how to add Google Analytics to your website.
Setting up Automatic and Enhanced Measurement Events
To turn on Enhanced Measurement in GA4, first log into your Google Analytics account and click on Admin in the bottom left corner.
Next, look for Data Streams in the middle column and click on your website’s data stream.
Accessing Google Analytics Data Streams
You’ll see Enhanced Measurement settings with a gear icon, so click that to see all your tracking options.
Configuring enhanced measurement in GA4
I started by turning on all enhanced measurement options on my site. This gave me a good baseline of data, and I could always turn off the ones I didn’t need later.
Enhanced Measurement options in GA4
Setting Up Recommended and Custom Events
To set up recommended events in GA4, you’ll need to add some code to your website. The easiest way to do this is with Google Tag Manager.
First, log into your Tag Manager account and click on Tags in the left menu. Then click New to create a tag for each event you want to track.
Adding a new tag in Google Tag Manager
Here’s how I set up purchase tracking on my website using Tag Manager:
Click on “Tag Configuration” and choose “Google Analytics: GA4 Event” from the list.
Adding the Google Analytics: GA4 Event Tag
Next, type “purchase” as your event name. Under Event Parameters, add important details like value, currency, and items. These help GA4 understand what was purchased.
Adding purchase event parameters in Google Tag Manager
The tricky part is setting up the right trigger. For purchase events, you’ll usually need to set up a custom trigger that watches for specific checkout completion signals from your website.
Custom trigger configuration in Google Tag Manger
For custom events, the process is similar, but you get to choose your own event names.
On my site, I wanted to track when people clicked my newsletter signup button. I created a custom event called “newsletter_click” and set it to trigger whenever someone clicks that specific button.
Remember to test your events after setting them up. You can use GA4’s DebugView to make sure everything is working correctly.
GA4 Debug View
How to Simplify GA4 Event Tracking
Having spent hours digging through GA4’s complex reports to find my event data, I knew there had to be a better way. With all the automatic, enhanced, recommended, and custom events we just set up, I needed a simpler way to see what was actually working. That’s why I started using OnePageGA.
OnePageGA
OnePageGA turns all your event tracking data into simple, easy-to-understand reports, all on one page. You don’t need to install any plugins or touch any code. Just connect your GA4 account, and you’ll see all your events in a way that actually makes sense.
OnePageGA single page GA4 dashboard
I love using OnePageGA because it saves me so much time checking my events. Instead of clicking through GA4 menus, I can instantly see which events are firing, how many conversions I’m getting, and where people are dropping off in my funnel. It shows me exactly how visitors interact with my site without the technical analytics language.
OnePageGA GA4 events report
Another big plus is that unlike other GA4 alternatives, OnePageGA doesn’t charge based on how many events you track or how many page views you get. Your cost stays the same even as your tracking needs grow.
You get access to everything: event tracking reports, conversion funnels, eCommerce events, and even multiple website tracking from one dashboard.
Events in GA4 are actions that visitors take on your website. They show you exactly what people do – from viewing a page to clicking a button or making a purchase. Every interaction on your site can be tracked as an event in GA4.
How do automatically collected events differ from enhanced measurement events?
Automatically collected events start tracking as soon as you add your GA4 code – things like page views and first visits. Enhanced measurement events need to be turned on in your settings, but give you more detail like scroll tracking and video plays. I use both types because they work together to give me a complete picture.
Can I customize recommended events?
Yes, you can customize recommended events. While Google suggests specific names and parameters for these events (like “purchase” or “sign_up”), you can add your own parameters to collect extra details that matter for your business. Just remember to keep the main event name the same so GA4’s reports work correctly.
How do I document and debug my custom events?
I use GA4’s DebugView to test all my custom events. To access it, click Configure, then DebugView in GA4. For documentation, I keep a simple spreadsheet listing each event name, what it tracks, and any custom parameters. This helps me stay organized and makes it easier to update events later.
Get Started With GA4 Event Tracking
Event tracking in GA4 might seem complicated at first, but it doesn’t have to be. Start with the automatic events, turn on enhanced measurement, and slowly add recommended and custom events as you need them.
Want to make event tracking even easier? Try OnePageGA free for 14 days and see all your event data on one simple dashboard.
How to Find Your Top Converting Traffic Sources in GA4
Posted on - Written By:
Stacey Corrin
Contents
Finding out where your best customers come from shouldn’t be hard. But with Google Analytics 4 (GA4), many website owners find it tough to see which traffic sources bring in actual sales.
For small businesses and online stores, this information really matters. You need to know if your customers find you through Google searches, social media, or other websites. Without this knowledge, you might be spending money on marketing that isn’t working.
That’s why I created this guide. I’ll show you how to find your best-performing traffic sources in GA4, and then share an even simpler way to track this information using OnePageGA.
Why Track Google Analytics Traffic Sources?
Every visitor to your website leaves a trail that shows how they found you. Some people click through from Google search, while others come from Facebook posts or links on other websites. Knowing these paths helps you understand what’s working in your marketing.
Let me share a personal example. On my previous website, I spent hours each week creating social media content. I was convinced social media was driving most of my traffic, after all, I was putting most of my effort there.
But when I dug into my analytics, I learned that 80% of my visitors were finding my site through Google. All that time I spent on social media was bringing in just a small fraction of my traffic.
This changed everything about how I approached my marketing. Instead of spending most of my time on social posts, I focused on creating content that would rank well in Google. My traffic grew, and I saved hours of work each week.
When you track your traffic sources, you can make smarter decisions about where to focus your efforts, just like I did. You might find that some sources bring lots of visitors, while others barely make an impact.
This knowledge helps you:
Spend your marketing budget where it works best
Create content that attracts more of your ideal customers
Stop wasting time on channels that don’t bring results
Find new opportunities to reach similar customers
Steps to Find Top-Converting Traffic Sources in GA4
Finding your converting traffic sources in GA4 takes a few steps. But don’t worry, I’ll walk you through each one with clear instructions.
Step 1. Locate Traffic Acquisition Report in Google Analytics
First, log into your Google Analytics account. Once you’re in, click on “Reports” in the left menu of your screen.
GA4 Reports
Next, look for “Life cycle” and select “Acquisition” from the options below it. You’ll then want to click on “Traffic acquisition” to open the main report.
GA4 Traffic Acquisition report
This report shows you where your website traffic comes from. You’ll see channels like “Organic Search” for Google traffic, “Paid Search” for ads, and “Social” for social media visitors.
Step 2. View Your Conversion Rate by Traffic Source
The Traffic Acquisition Report shows you a table of all your traffic sources. Each row tells you how website visitors found your website, whether through Google search, social media, or other websites.
Look for the “Events” column first. This shows you all the actions visitors take on your site.
GA4 Traffic Acquisition report Events
You can click the dropdown here to see specific types of events, like page views or button clicks.
Next, scroll to the right until you find the “Session key event rate” column. This number tells you how many visitors from each source take important actions on your site, like making a purchase or signing up for your newsletter.
Session Key Event Rate in GA4
This rate is your key to understanding which traffic sources bring in the best visitors. A higher percentage means more people from that source are doing what you want them to do on your website.
If you want to quickly spot your best sources, just click the “Session key event rate” column header. This will sort them from highest to lowest.
Step 3. View Conversions by Landing Page
Now let’s go deeper and see which specific pages bring in converting visitors.
Click the plus icon in your report to customize what you’re looking at. From the dropdown menu that appears, select “Page/Screen” and then “Landing page + query string.”
Filter GA4 report by landing page
Your report will now show two columns side by side: one for the traffic source (like Direct, Organic Search, or Paid Search) and another for the landing page.
Traffic acquisition report filtered by landing page and query string
Look at the “Event count” and “Key events” columns to see how many actions visitors take on each page.
The “Session event rate” shows you which combinations of sources and pages convert best. This helps you spot your highest-performing pages for each traffic source.
Find Top-Converting Traffic Sources Using OnePageGA
Looking at all these different reports and columns in GA4 can get confusing. If you’re like most website owners, myself included, you just want to see your best traffic sources without digging through multiple reports.
OnePageGA is a simple dashboard we created to solve this problem. It connects to your Google Analytics account and pulls all your important data onto one screen.
OnePageGA Homepage
Instead of clicking through different reports and scrolling through columns, you see your top traffic sources and conversion rates instantly.
Think of it as your Google Analytics data, but organized the way you actually want to use it. No technical setup, no complex reports, just clear insights about where your best visitors come from.
Step 1. Set Up OnePageGA
Setting up OnePageGA takes just a minute.
Visit onepagega.com and click the “Sign Up” button. Then connect your Google Analytics account. It’s just like signing in to any other Google service.
Sign up for OnePageGA
Step 2. View Top-Converting Traffic Sources on One Page
Once connected, you’ll see a pre-built dashboard at the top of your page. This shows you the essential metrics about your website’s performance right away, with no setup needed.
Below that, you’ll find two simple reports side by side. The Sources report shows where your visitors come from, along with key metrics like users and revenue.
OnePageGA sources report
The Pages report shows which landing pages bring in the most traffic and value.
OnePageGA pages report
Each report comes with powerful filtering options. In the Sources report, you can filter by Channel, Source, First Source, or First Channel.
The Pages report lets you filter by Landing Page, Pages, or Title. This helps you zoom in on exactly what you want to see.
If you need more detailed data, click “Load more” at the bottom of either report. This opens a sidebar with a complete list of your sources or pages, plus a search bar to find specific entries quickly.
Expanded sources report in OnePageGA
That’s all there is to it. Everything you need to understand your traffic sources is right there on one page, updated in real-time.
Take Control of Your Traffic Analytics
Knowing where your best traffic comes from is one of the best ways to make data-driven decisions about your business. While GA4 is powerful, it’s also overwhelming for a lot of users. There’s so much detail to absorb and it takes time to fully understand.
With OnePageGA, analytics is much simpler. You get all the detailed tracking you need, presented in a way that’s easy to understand and act on.
Start by exploring your traffic sources in GA4 using the steps above. Then, when you’re ready for simpler analytics, sign up for a 14-day free trial of OnePageGA.
After all, knowing where your best visitors come from shouldn’t require a degree in data analysis.
If you’re looking for more ways to understand your website’s traffic, see our other guides and resources:
Choosing Top Web Analytics Tools? 7 Mistakes You Must Avoid
Posted on - Written By:
Stacey Corrin
Contents
Every business needs to understand how their website performs. But picking the right tool to track this data isn’t easy. Choose the wrong one, and you might end up with data that doesn’t make sense and money down the drain.
Your website’s success depends on understanding how visitors behave, which makes picking the right web analytics tools crucial for your business. Yet, I’ve seen many website owners rush this decision, choosing tools without proper research or planning.
That’s exactly why I created this guide. I’ll walk you through the biggest mistakes people make when selecting analytics tools. By knowing what to avoid, you’ll find it easier to pick the right analytics solution for your business.
They track and record what happens when people visit your site. Every click, every page view, and every action your visitors take gets collected and turned into useful information.
These tools tell you how many people visit your site, which pages they look at, how long they stay, and where they came from. Some tools even show you how visitors move through your site and what they do before leaving.
At their heart, web analytics tools help answer key questions about your website:
Are people finding what they need?
Which pages work best?
Where do visitors get stuck?
By answering these questions, you can make smarter decisions about your website.
What Types of Web Analytics Are There?
Not all web analytics tools work the same way. Different tools track different things, and understanding these differences helps you pick the right one.
Traditional analytics tools show you basic website traffic data. They track visitors, popular pages, and how long people stay on your site. These tools give you the essential data you need to measure site performance.
Behavior analytics tools reveal how visitors interact with your site. They track clicks, scroll depth, and can replay user sessions. This helps you find and fix usability issues quickly.
Customer journey analytics track how people interact with your business across all channels. From social media to email to your website, you’ll see the complete path customers take.
Content analytics measure how well your website content performs. They show which topics engage readers and where you’re losing their attention.
SEO analytics tools track your search engine performance. You’ll see your keyword rankings, backlinks, and how you compare to competitors.
Mistakes To Avoid Choosing Web Analytics Tools
Understanding what analytics tools can do is just the first step. Choosing the right one for your business is where many website owners stumble.
Here are the mistakes you’ll want to avoid when making your decision.
1. Starting Without Clear Goals
Many website owners jump straight into picking an analytics tool because they know they need one. But that’s like buying a map without knowing where you want to go. Without clear goals, you’ll end up with data you don’t know how to use.
Take a moment to write down 2-3 specific questions you want your analytics to answer.
What questions your web analytics should answer
Maybe you want to find out why people leave your checkout page. Or you might need to track how well your marketing campaigns bring in sales. Are you trying to understand where visitors click on your homepage?
Your answers will guide you toward tools that match your needs, saving you time and money in the long run.
2. Going with the Cheapest Option
When you’re comparing web analytics tools, it’s tempting to pick the cheapest one. But choosing a tool based only on price often leaves you missing key features you’ll need later.
Free tools might work when you’re just starting, but they rarely give you the full picture of your website’s performance.
The only real exception to this rule is Google Analytics, which is free. But the trade off is that it’s often quite complicated to use right out of the box.
Google Analytics dashboard
Think about what you’re giving up to save money. Lower-priced tools often come with limited data storage, basic reporting, and minimal support. When you need help understanding your data or fixing tracking issues, you might find yourself stuck without expert guidance.
The right analytics tool is an investment in your website’s success. Instead of focusing on the price tag, think about the value you’ll get.
Will the tool help you make better decisions? Can it grow with your business? These questions matter more than saving a few dollars each month.
3. Selecting a Tool That’s Too Hard to Use
You might think the most powerful analytics tool is the best choice. But if your team can’t use it properly, all those advanced features are worthless.
Believe me, I’ve made that mistake myself, picking a complex tool that looks great on paper, but which ends up collecting dust because I didn’t know how to use it.
Your analytics tool should work for everyone on your team, from marketing experts to sales staff.
Let me give you an example. Some team members might love detailed reports, which you can easily get from a comprehensive tool like Google Analytics.
But others may just need quick insights, making OnePageGA a much better solution.
Example of simple reporting in OnePageGA
Look for tools with clear dashboards and straightforward reports. Your team should be able to find the information they need without attending multiple training sessions.
Remember, the best analytics tool isn’t the one with the most features – it’s the one your team will actually use.
4. Skipping Free Trials and Demos
Reading product descriptions and watching promotional videos isn’t enough to know if an analytics tool is right for you. That’s like buying a car without taking it for a test drive. Marketing materials always show the perfect scenario, but you need to experience the tool in real life.
Most analytics providers offer free trials or demos for a reason. Use this time to test the features that matter most to your business.
For example, with OnePageGA, you get a 14 day free trial to take the whole platform for a test drive.
OnePageGA 14 day free trial
Try creating the reports you’ll need regularly. See how quickly you can find important data. Check if the tool actually answers those key questions you noted down earlier.
Don’t forget to test the support team during your trial. Send them questions and see how quickly they respond. A tool is only as good as the help you get when something goes wrong.
5. Ignoring Marketing Integrations
Your website doesn’t exist in a bubble. Visitors arrive from email campaigns, social media posts, and online ads. That’s why your web analytics tool needs to work with your other marketing platforms.
When your tools don’t talk to each other, you miss important parts of the story.
You might see that someone bought your product, but not know which email campaign brought them to your site. Or you might spot a surge in traffic without understanding which social post caused it.
Good analytics tools connect with your email platform, CRM, social media accounts, and ad networks.
Important web analytics tools integrations
These connections help you track the complete customer journey, from first click to final purchase. Without them, you’re left with gaps in your data and guesswork in your decisions.
6. Forgetting About Scalability and Growth
The analytics tool that works for you today might not meet your needs tomorrow. Your website will grow, your traffic will increase, and you’ll need more detailed insights.
Plus, switching later is painful. You’ll lose historical data and need to retrain your team.
Think about where your business will be in a year or two:
Will your current tool handle double the traffic?
Can it store more data?
What happens when you need to track multiple websites or add new team members?
A tool that seems perfect now might become a headache as you grow.
Look for cloud-based web analytics tools that grow with your business. Check if they offer flexible pricing plans and easy ways to upgrade.
The right tool should support your success, not limit it.
7. Treating Data Privacy as an Afterthought
Data privacy isn’t just nice to have, it’s essential. More countries are passing strict privacy laws like GDPR and CCPA, and customers care deeply about how their information is handled.
Consumers won’t buy from companies they don’t trust.
In fact, 75% of consumers say they won’t purchase from organizations they don’t trust with their personal data. One privacy mistake could cost you thousands in fines and damage your reputation.
That’s why your analytics tool needs to make privacy simple. Look for features like data anonymization, consent management, and clear privacy settings. The best tools help you collect valuable insights while protecting your visitors’ privacy.
Before choosing a web analytics tool, dig into its privacy policy and security measures.
Can you delete visitor data when requested? Is data stored securely? Does the tool collect only what you actually need?
Getting these answers now helps you avoid privacy problems later.
What’s the Best Web Analytics Tool for You?
When it comes down to it, Google Analytics 4 (GA4) is the most popular web analytics tool in the world. It’s used by over 15 million websites for good reason, it’s powerful and free.
And after over a decade of using it on my own websites, I’ve found that combining GA4 with OnePageGA works best for most businesses.
OnePageGA
OnePageGA is a simple analytics dashboard that sits on top of GA4. It takes complex Google Analytics data and turns it into clear, actionable insights.
Instead of digging through multiple reports and settings, you get a single dashboard that shows you what matters most.
OnePageGA dashboard example
With OnePageGA, you can quickly spot trends, track goals, and measure your website’s success. It highlights important changes in your traffic, shows which content performs best, and helps you make data-driven decisions without the steep learning curve of GA4.
This gives you the best of both worlds: GA4’s detailed tracking and OnePageGA’s user-friendly approach to viewing and understanding your data.
But depending on your needs, you might want to add other tools to your analytics stack.
Now that you understand the common mistakes to avoid and the types of tools available, let’s put everything together.
Here’s your step-by-step guide to choosing the best web analytics tools:
Define your goals clearly before looking at any tools
List the features you need to achieve these goals
Set a realistic budget that matches your needs
Test free trials with real website scenarios
Check if the tool works with your other marketing platforms
Make sure the interface is easy for your team to use
Verify the tool’s privacy features and compliance
Consider how the tool can grow with your business
Remember to take your time with this decision. The right web analytics tool will help your business grow, while the wrong one can waste time and resources.
Making the Right Choice for Your Business
Choosing the right web analytics tool doesn’t have to be overwhelming. By avoiding common mistakes and following a clear selection process, you can find one that serves your needs now and as your business grows.
Start with the basics using Google Analytics 4 and OnePageGA. This gives you powerful tracking with easy-to-understand insights.