
As a small business owner, your website is essential. Naturally, you want more visitors, and Google Analytics is the tool you turn to for understanding your website traffic.
But with the roll-out of GA4, there are so many more metrics and dimensions to keep track of. It’s hard to know which are the most important to use regularly.
Take Users, for example. GA4 has four different types of users. So what is a user in Google Analytics, and how can you use this info to make data-driven decisions about your business?
In this guide, I’ll break down GA4’s four user metrics: Active, New, Total, and Returning, in plain English. You’ll learn exactly what they measure, when to use them, and more importantly, how they can help you grow your business.
What Are The Different Types of Users in GA4?
Before diving into the details, here’s a brief look at the four types of users in GA4:
- Total Users: Everyone who visited your website during your chosen time period.
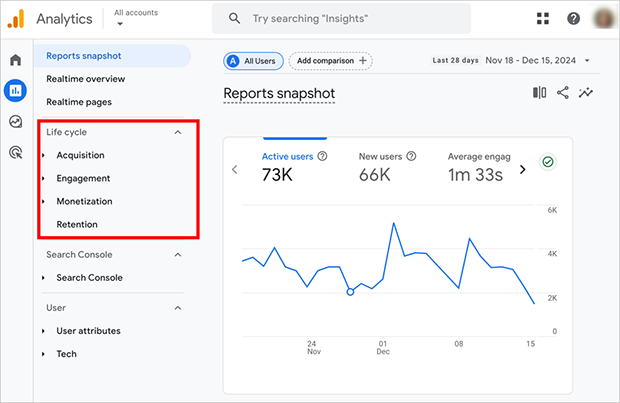
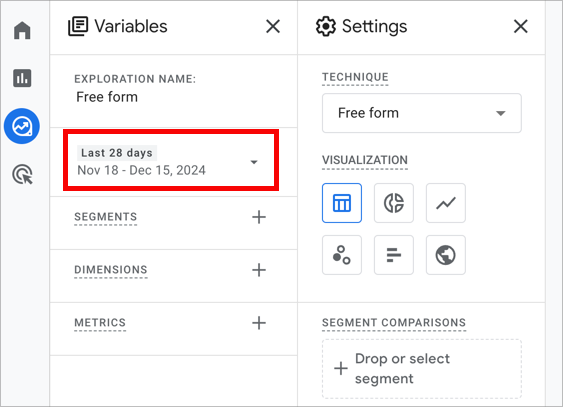
- Active Users: People who visited your site in the last 28 days.
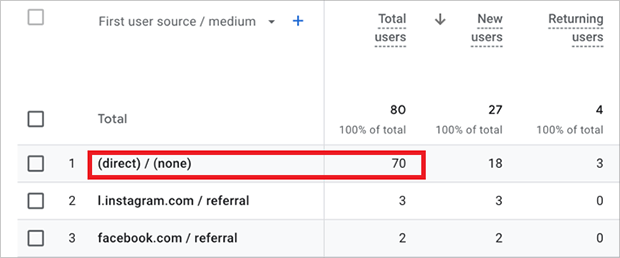
- New Users: First-time visitors to your website.
- Returning Users: People who have visited your site before and came back.
These metrics work together to give you different views of your website traffic. Let’s look at each one in detail to understand how they can help your business.
Total Users in Google Analytics
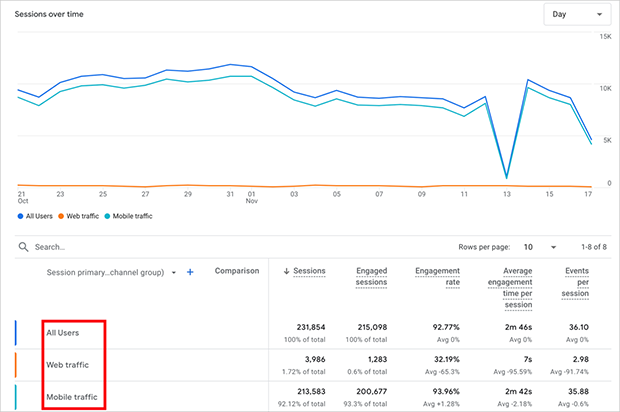
Total Users includes everyone who lands on your site—even if they leave after a few seconds. Think of it as your website’s total foot traffic, including both the serious shoppers and the window browsers.
This data helps you see if your website is growing over time. You might use it to see if this month’s growth was better than last month’s, or to check if your new marketing efforts are working.
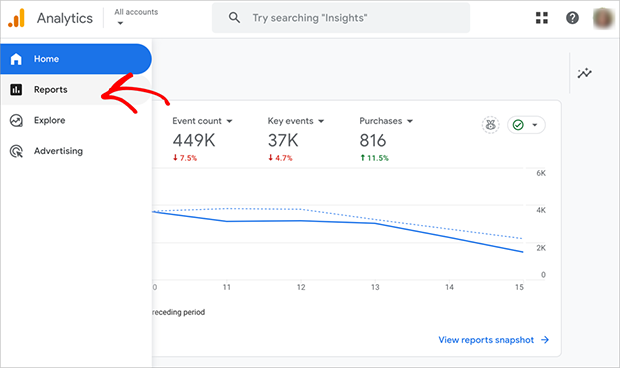
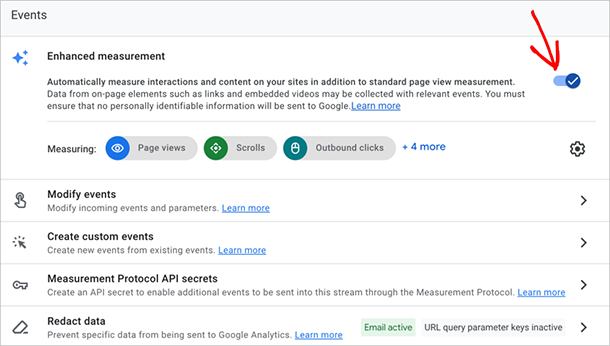
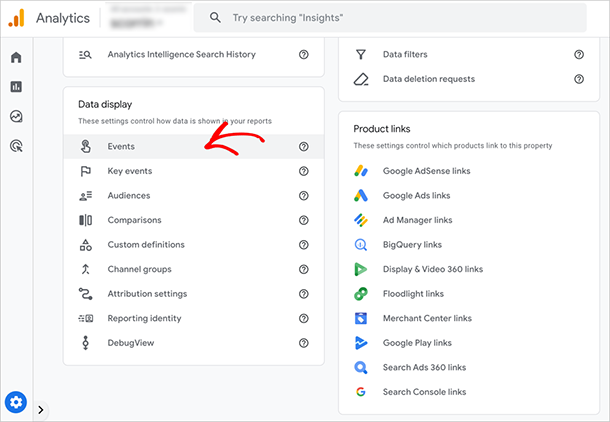
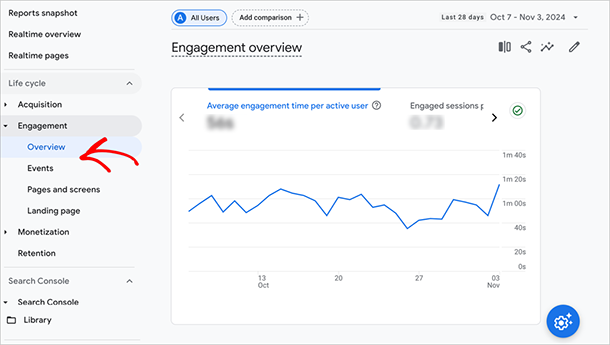
You can find detailed Total Users data in your Events report (Reports » Engagement » Events). This shows you exactly how people interact with your site.
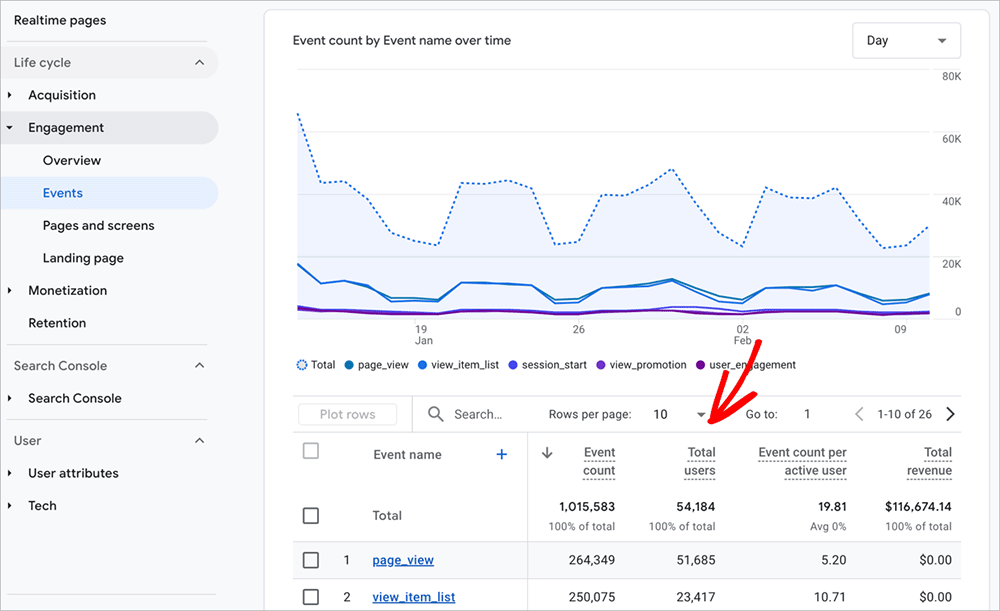
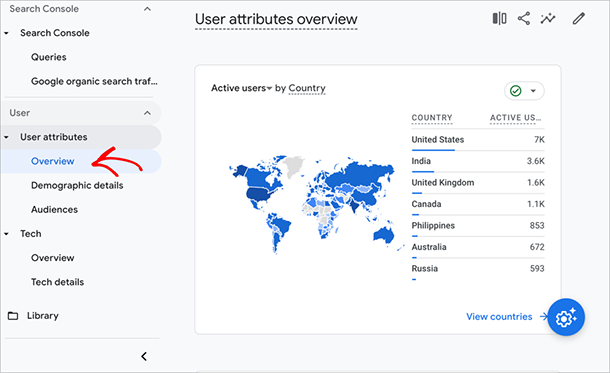
For instance, you might learn that while 7,000 people visited your site, only 400 watched your video—giving you clear insight into where you could improve engagement.
Think of it this way: If 1,000 people visit your site, but nobody buys anything, that might be worse than having 100 visitors who all make purchases. Quality can be far more important than quantity.
Active Users in Google Analytics
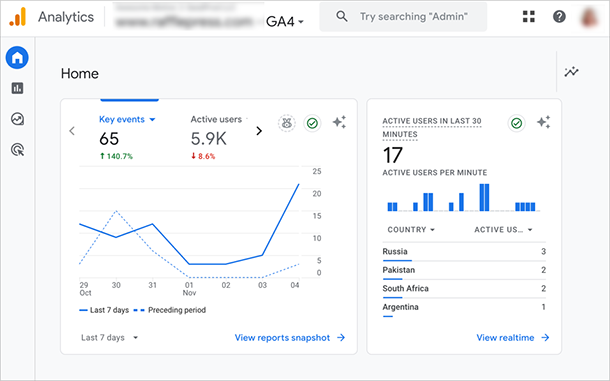
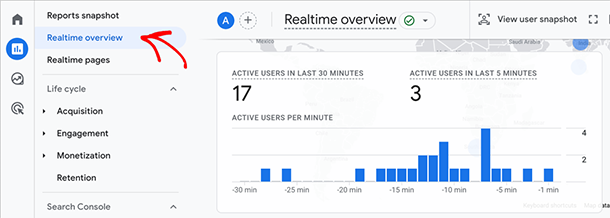
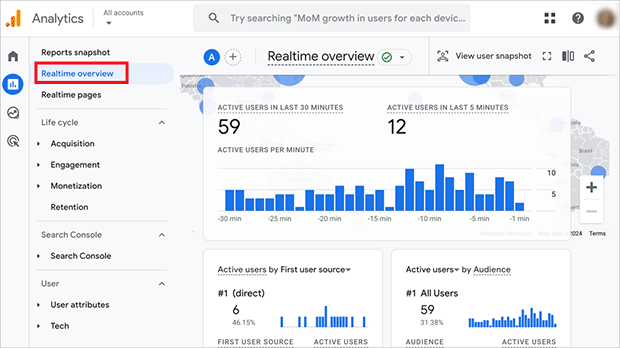
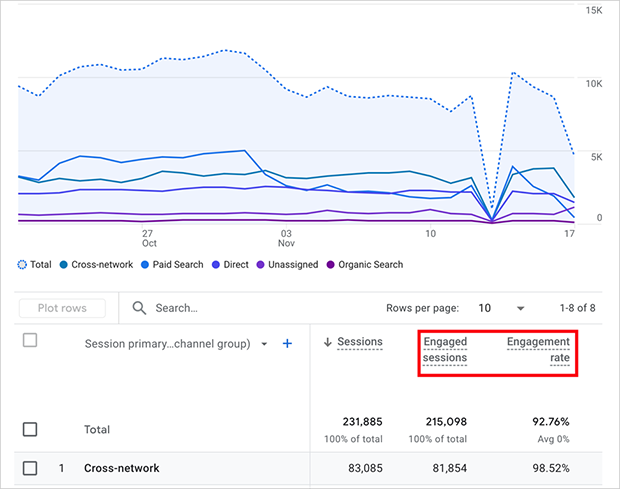
Google Analytics considers Active Users so important, they made it their default metric. Whenever you see ‘users’ listed without any qualifier, GA4 is showing you ‘active users’.
In GA4, active users are either new visitors or users with engaged sessions. An engaged session means the visitor either:
- Stayed on your page for over ten seconds
- Viewed more than one page
- Made at least one conversion
It’s a lot like a gym membership – you care more about who worked out this month than who signed up three years ago and never came back. The 28-day window helps you spot patterns and identify who’s genuinely interested in what you offer.
This metric is especially helpful if you run a blog or sell products that people don’t buy right away. It shows you who keeps coming back to learn more before making a decision.
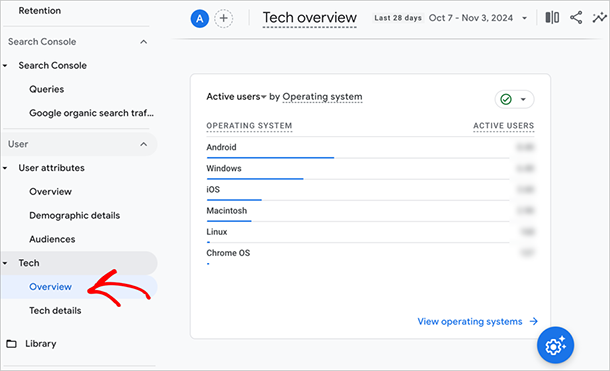
Pro Tip: While Universal Analytics (pre-July 2023) had a dedicated Active Users report, GA4 integrates this metric throughout its interface. You can find detailed active user data in the ‘Engagement report’.
New Users in Google Analytics
New Users shows you how many people are visiting your website for the first time. In GA4, this is tracked as a ‘first_visit’ or ‘first_open’ event, making it easy to spot fresh faces in your analytics.
Think of New Users like first-time customers walking into a store. They’re exploring and getting to know what you offer, so it’s important to make a good first impression so they’ll want to come back.
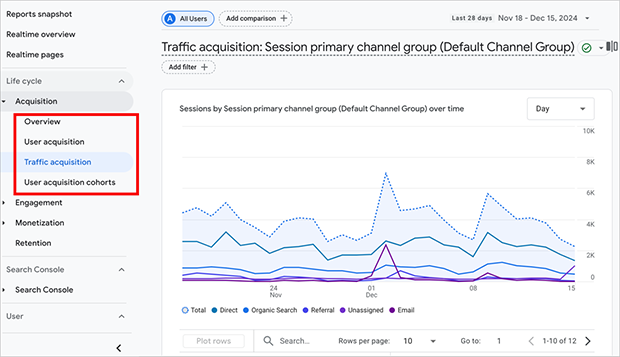
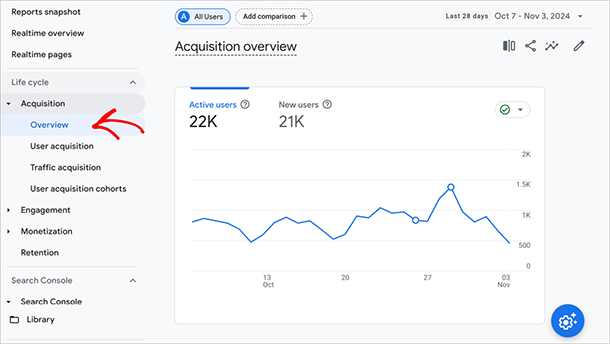
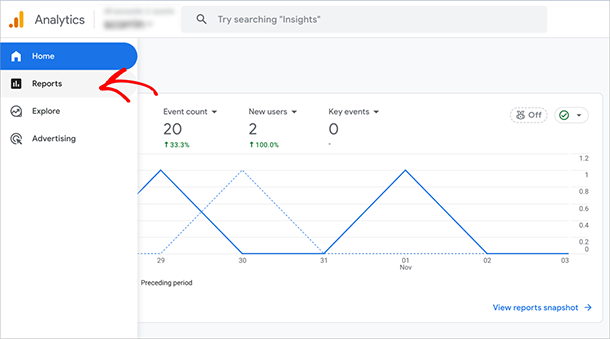
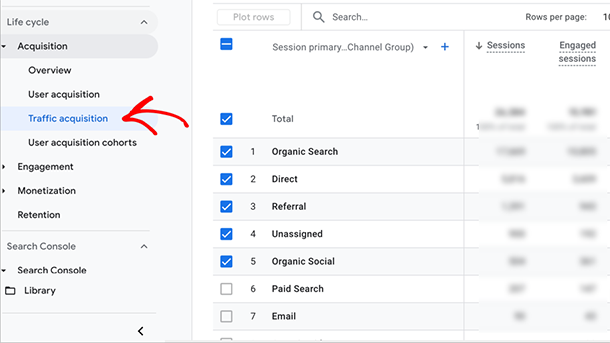
You can find your new user data by going to Reports » Acquisition, where you’ll get a quick overview of how many fresh visitors your site is attracting.
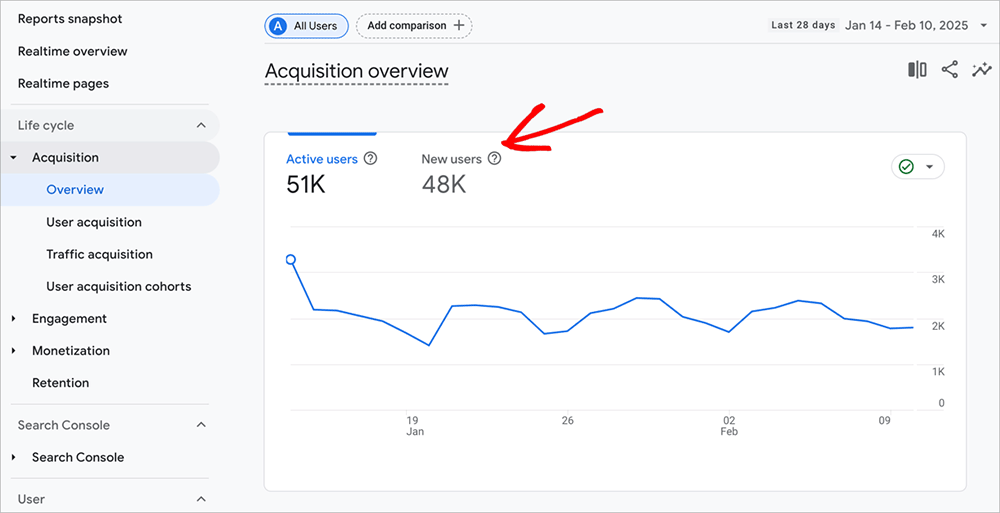
You’ll see spikes in New Users when something drives extra traffic to your site – maybe you ran a Facebook ad, got mentioned on social media, or one of your blog posts started ranking well in Google.
But New Users alone doesn’t tell the whole story. If you have many new visitors, but they don’t come back, you might need to work on making your site more engaging.
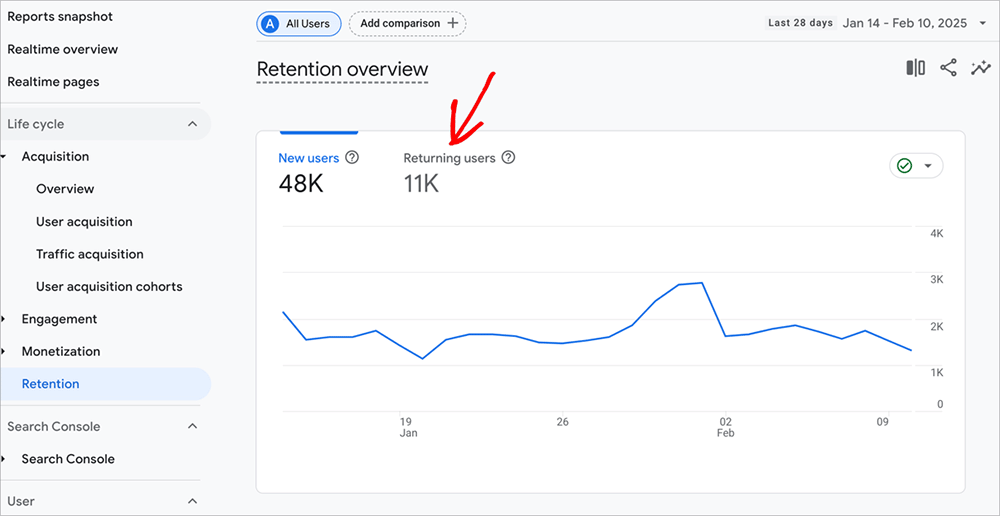
Returning Users in Google Analytics
While new visitors are great, returning users are even better. Not only does retaining users cost less than acquiring new ones, but returning visitors also signal that your content or products are hitting the mark.
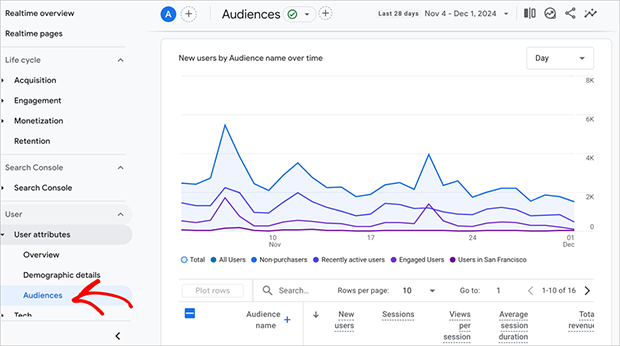
In GA4, anyone who has visited your site before counts as a returning user, even if their previous visit was brief. You can find these loyal visitors by going to Reports » Retention, where you can compare new vs. returning user patterns over time.
Think of Returning Users like regular customers at a coffee shop – they know what they like and keep coming back for more. A healthy website usually has a good mix of new and returning visitors, but too few returning visitors might mean people don’t find your site useful enough.
You can increase your Returning Users by creating helpful content, offering good products, or sending out regular newsletters. The key is to give people a reason to come back.
Research shows that returning customers spend 67% more than first-time buyers, making this metric particularly important for e-commerce sites.
For a deeper dive into metrics, see our guide: What Is a Metric in Google Analytics (And What to Track)
Now that we’ve defined each metric, let’s clearly see the key differences between them all.
Active Users vs. New Users vs. Total Users vs. Returning Users
Now, all of these user metrics can feel confusing, especially when you’re trying to figure out which ones matter most for your business. Here’s a breakdown of how they compare and when to use each one:
| User Type | Measures | Best For | Benefit | Limitation |
|---|---|---|---|---|
| Total Users | Everyone who visited during your chosen time period | Overall website reach | Gives the big picture view | Doesn’t show engagement quality |
| Active Users | People who visited in the last 28 days | Current website health | Shows recent engagement | Limited to 28-day window |
| New Users | First-time visitors only | Marketing campaign success | Measures audience growth | Doesn’t show if they return |
| Returning Users | Repeat visitors | Website loyalty | Shows content value | Might miss cross-device users |
Let’s look at a real example to show how these numbers work together.
Imagine your website had these metrics last month:
- Total Users: 1,000
- Active Users: 800
- New Users: 300
- Returning Users: 700
This tells an interesting story: while you had 1,000 total visitors, 800 were active recently. Most of your traffic (700) came from people coming back, with 300 new people discovering your site.
Pro Tip: If you find these metrics overwhelming to track all at once, focus on the ones that match your current goals. For a new website, New Users might matter most. For an established site, you might care more about Returning Users.
Using OnePageGA for Simpler User Data
Now, GA4’s layout often changes with updates, and finding user metrics across different reports is not only time-consuming, but also a headache. It’s actually something I used to dread because try as I might, my brain simply doesn’t like numbers.
That’s why I always use OnePageGA to view and interpret my GA4 data.

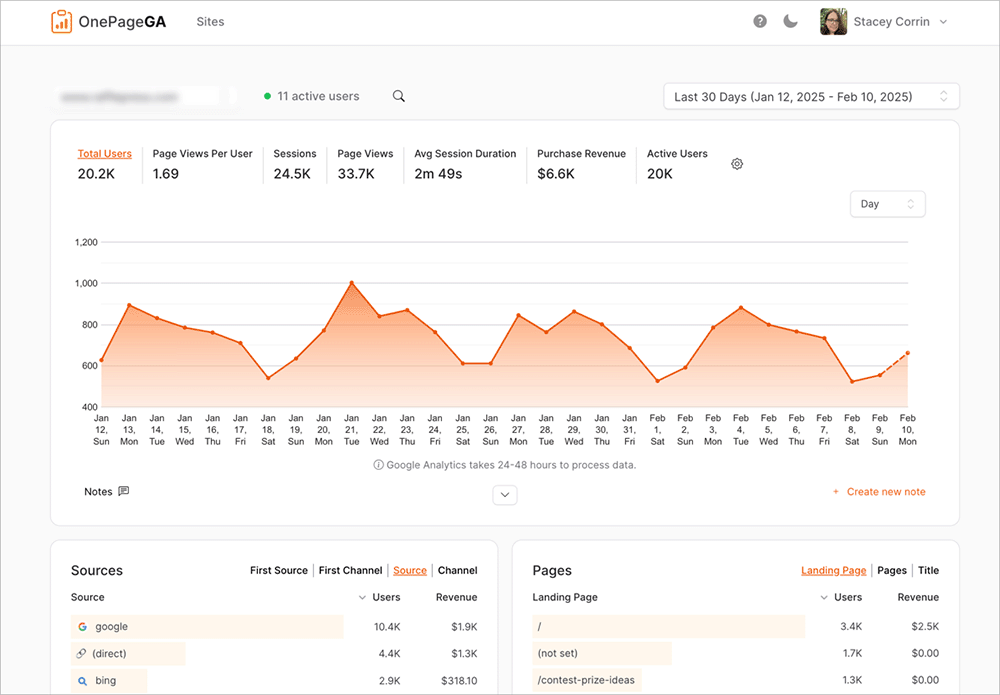
It’s a straightforward, single-page dashboard that simplifies your Google Analytics data. It shows an easy-to-understand overview of the metrics that are most important to your business.
When using OnePageGA, you can easily:
- Get insights without needing to learn the complex GA4 interface.
- See ready-made reports for traffic sources, top pages, user locations, and more.
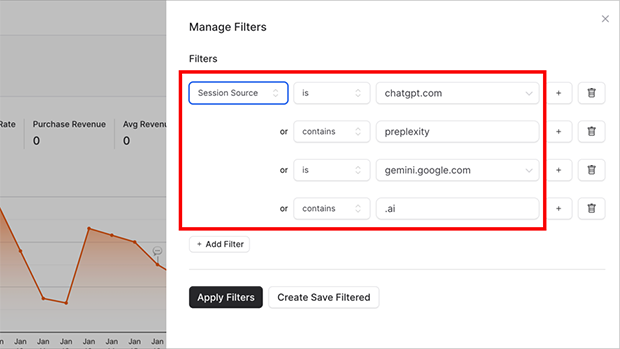
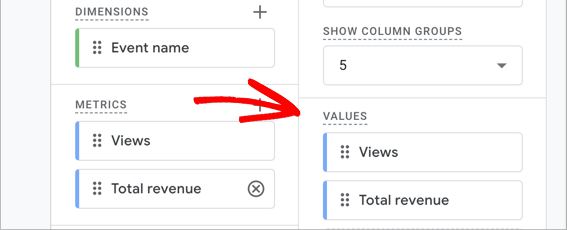
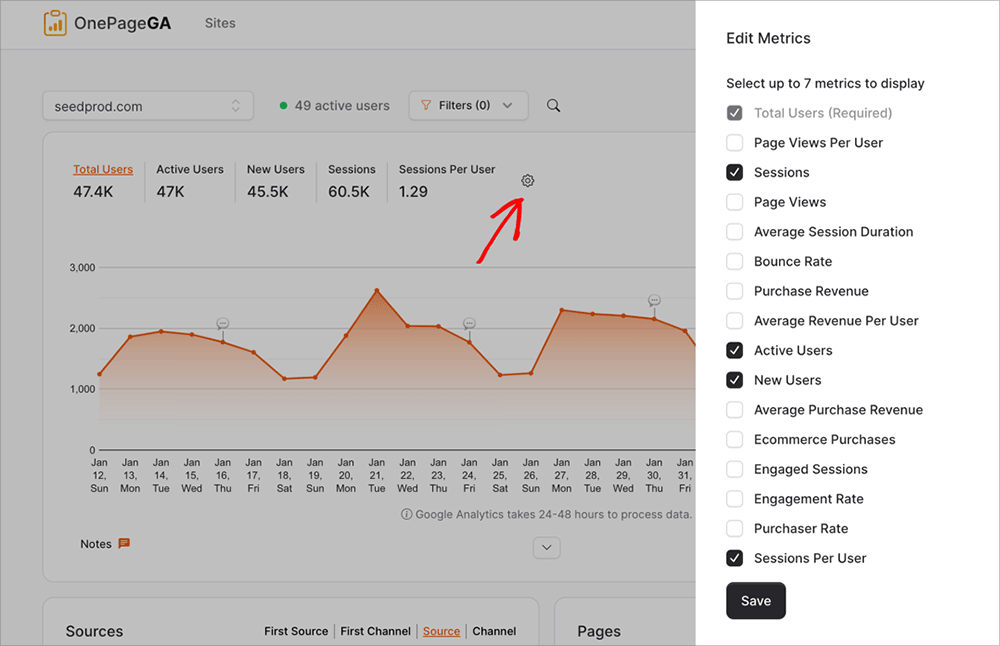
- Choose exactly which metrics to see in your reports, like Active & New Users.
- Track revenue and sales if you sell online, linked to user metrics.
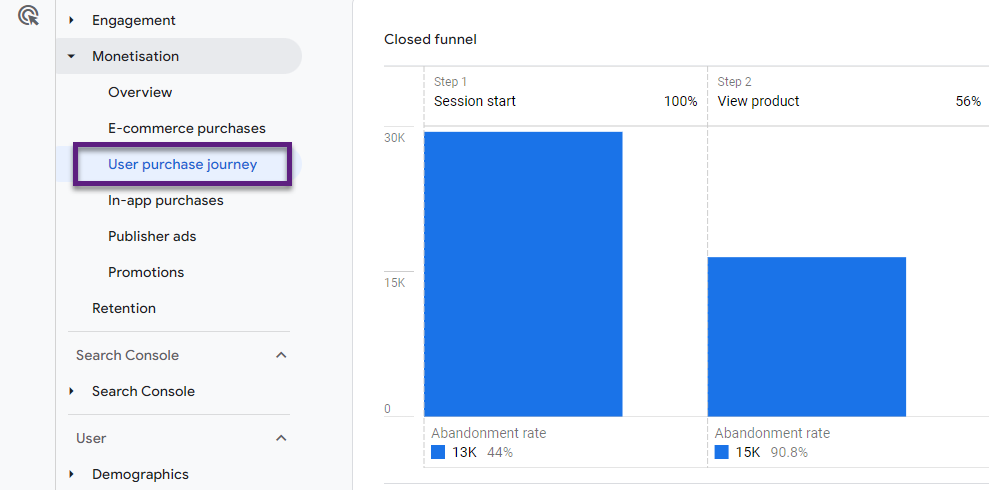
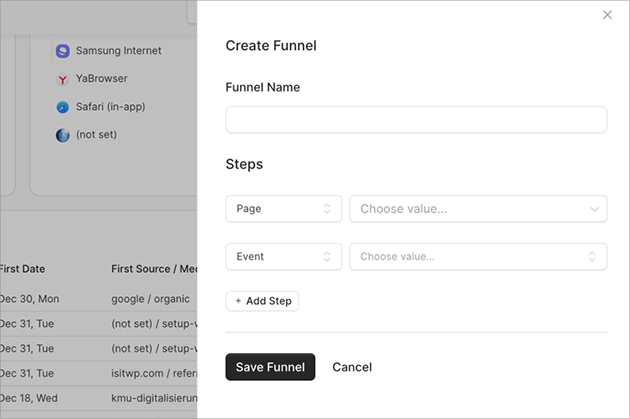
- Identify where users drop off in your customer journey.
- Monitor all your websites in one dashboard and track changes over time.
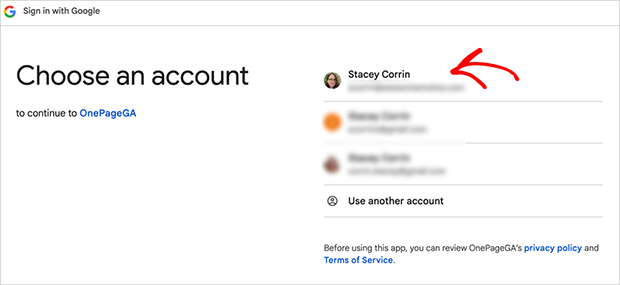
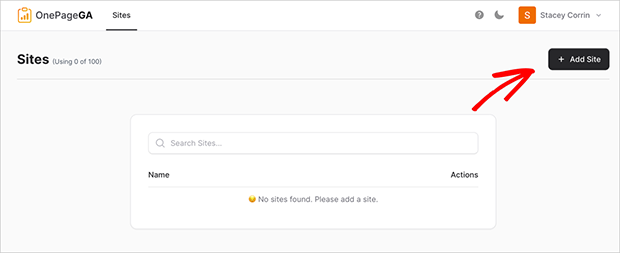
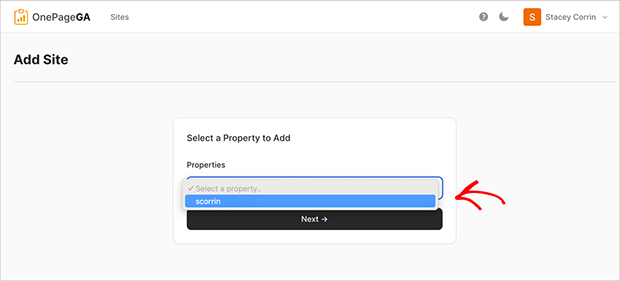
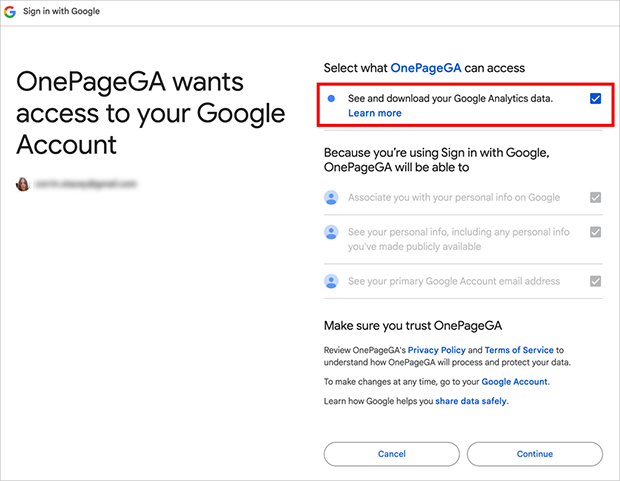
To find user data in OnePageGA, first, visit the OnePageGA website and sign up for a free account.

Simply click the “Sign up with your Google Account” button and follow the on-screen instructions to authorize OnePageGA to access your GA4 data.
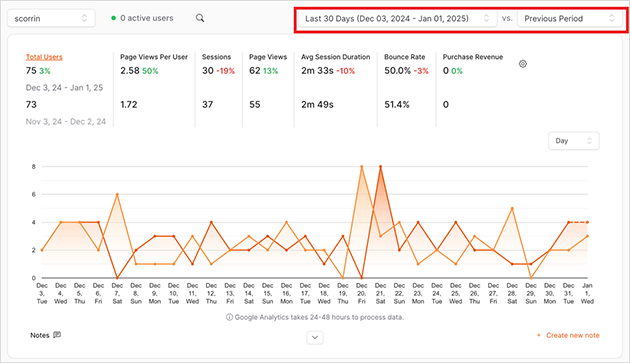
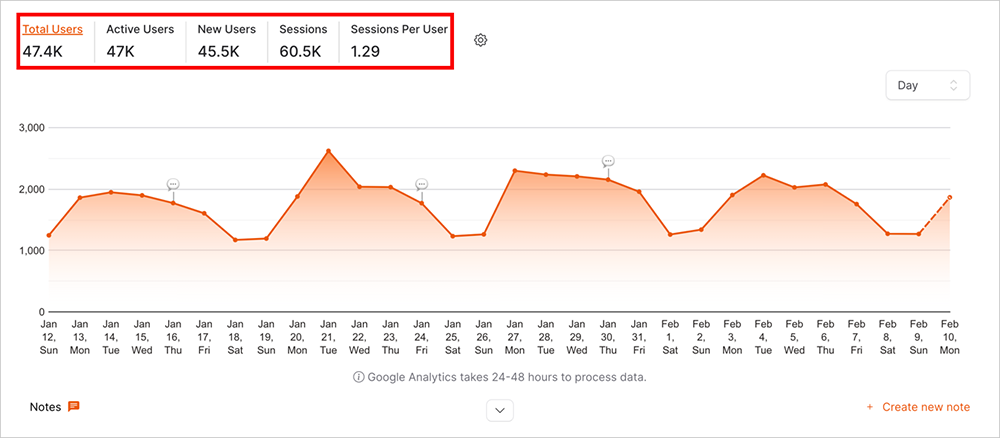
Once connected, you’ll see a pre-built dashboard with essential metrics.
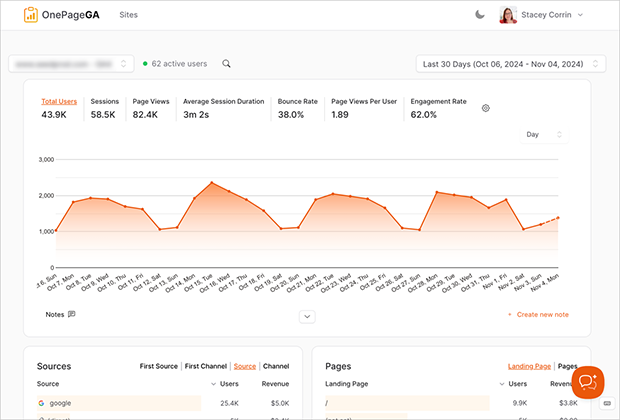
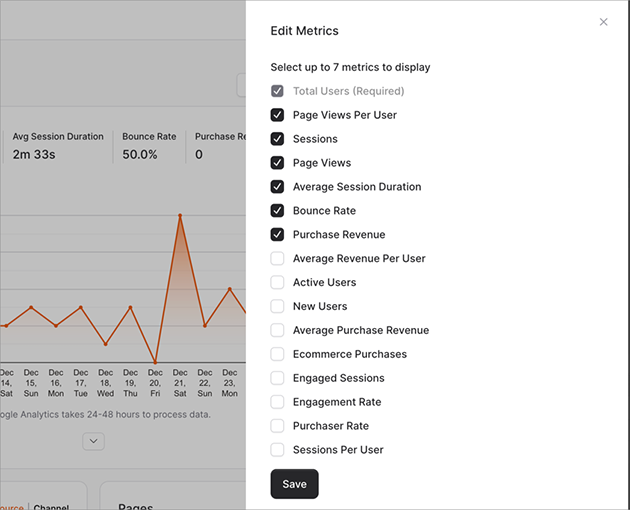
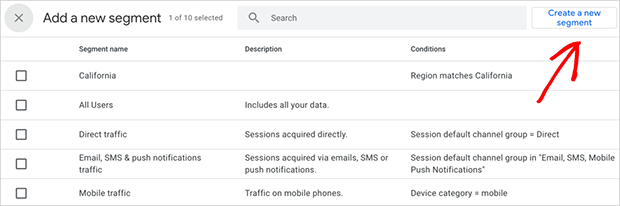
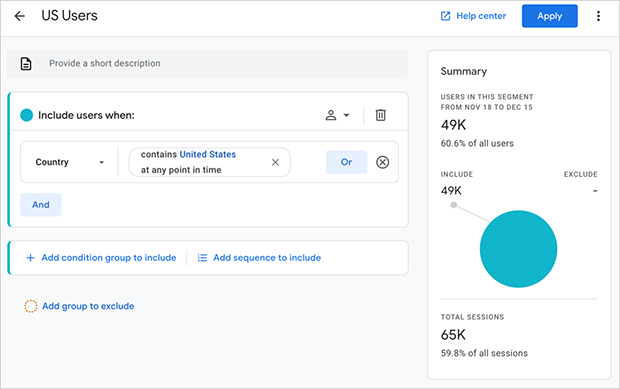
To customize the dashboard to include more User info, click on the “Edit Metrics” button and select the data you want to see.
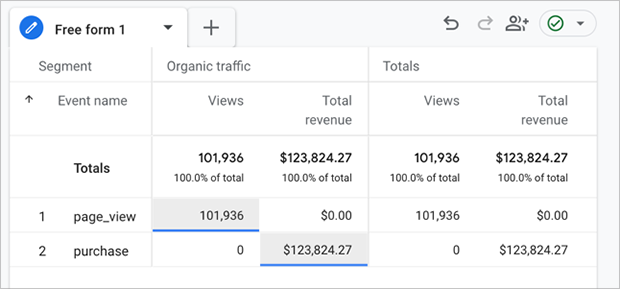
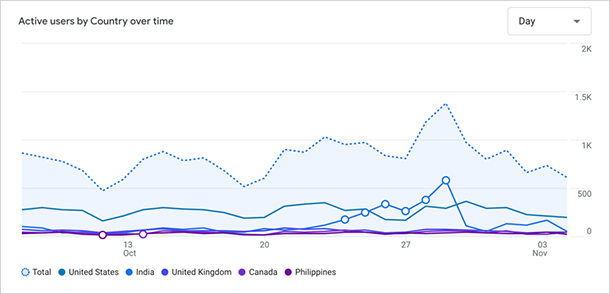
You’ll then see a chart of this data allowing you to see trends and compare different time periods.
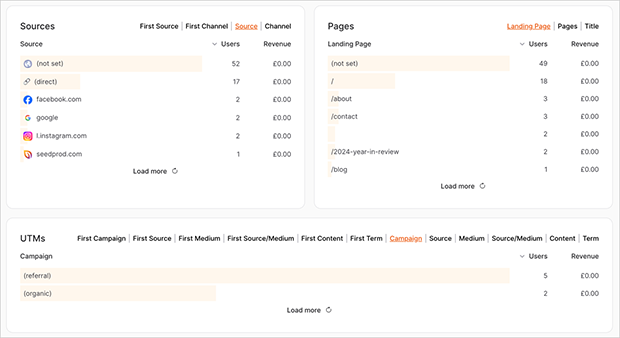
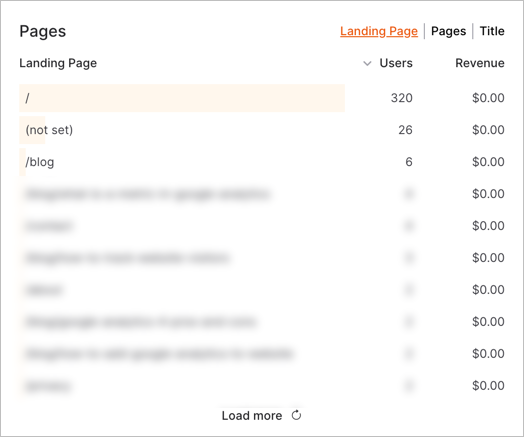
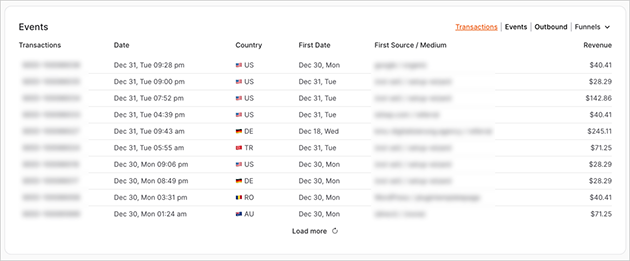
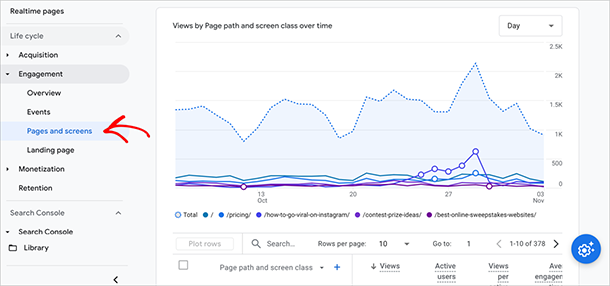
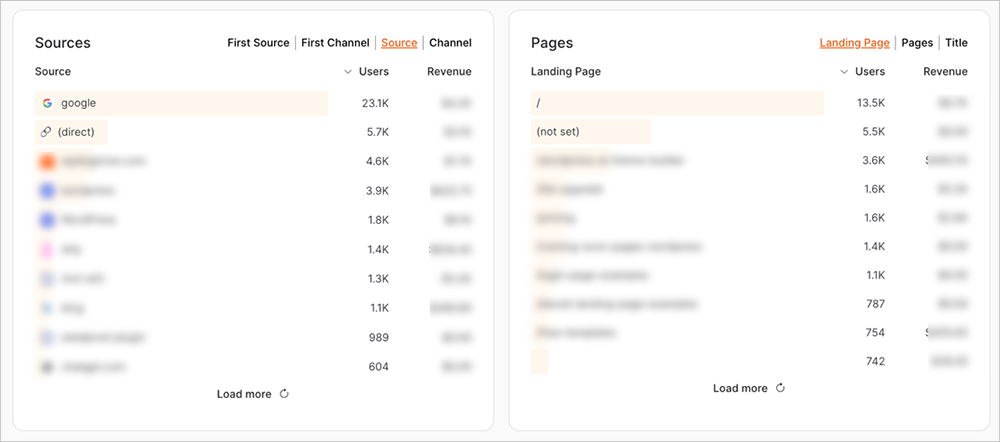
Below that, you can see further information with pre-built reports. For example, you can quickly view user data in relation to traffic sources, landing page, location, device, and much more.
Making Data-Driven Decisions with User Metrics
Now that you can easily find your user metrics in both GA4 and OnePageGA, let’s look at how to use this data to grow your business.
Here are some common scenarios and which metrics to watch:
When Launching a Marketing Campaign:
- Track New Users to measure campaign reach
- Watch Active Users to see if people stay engaged
- Monitor Returning Users to check if the campaign brings quality traffic
When Creating Content:
- Low Returning Users might mean your content needs work
- High New Users but low Return Users suggests engagement problems
- Steady Active Users shows your content keeps people interested
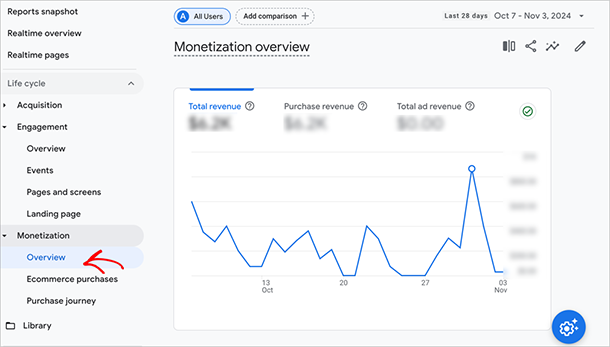
When Running an Online Store:
- Compare Total Users to sales numbers
- Track Returning Users to measure customer loyalty
- Watch Active Users to spot shopping patterns
For example, if you notice your New Users are high, but Returning Users are low, try:
- Improving your website’s first impression
- Creating more engaging content
- Starting an email newsletter
Pro Tip: Don’t try to track everything at once. Pick the metrics that match your current business goals and focus on those first.
Common User Metric Problems and Solutions
Even when you understand what these metrics mean, you might run into some common challenges. Here’s how to handle them:
| Problem | Possible Cause | Solution |
|---|---|---|
| High New Users but Low Sales | Poor website experience | Improve site navigation, add clear calls to action |
| Low Returning Users | Outdated content | Create fresh, relevant content regularly |
| Dropping Active Users | Seasonal changes | Compare to same period last year |
| Total Users Seem Wrong | Multiple devices counted twice | Focus on trends rather than exact numbers |
Remember: Numbers dropping isn’t always bad, and spikes aren’t always good. What matters is understanding why changes happen and taking appropriate action.
Understanding your website’s user metrics doesn’t have to be complicated. Whether you’re looking at Total Users for the big picture or Active Users for current engagement, each metric tells part of your website’s story.
By using tools like OnePageGA to simplify your analytics, you can focus less on finding the data and more on using it to grow your business.
Try OnePageGA free for 14 days and see how easy tracking users can be.
If you’re looking for even more help using Google Analytics, you may also find the following resources useful:
- 5 Types of Website Analytics Every Website Owner Should Know
- How to Track Website Visitors the Easy Way
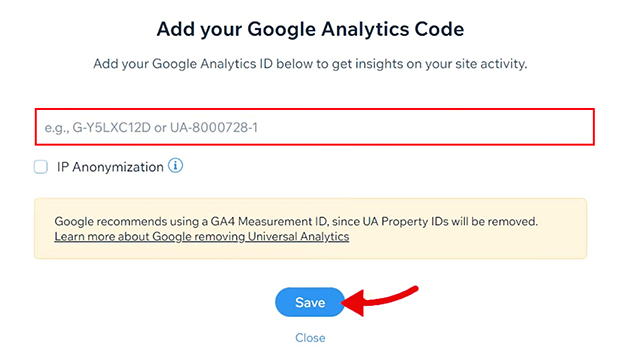
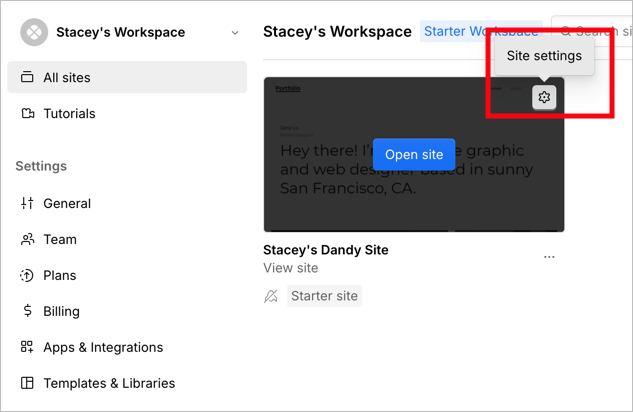
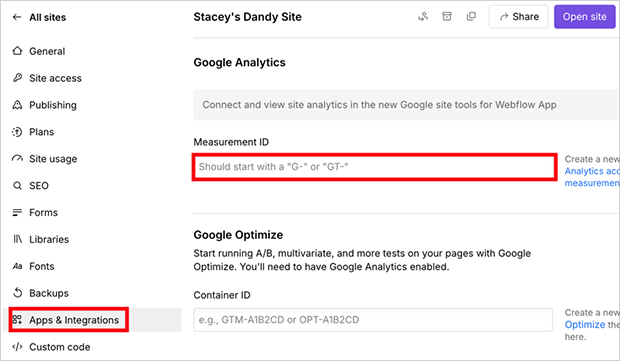
- How to Add Google Analytics to Your Website
- Is Google Analytics 4 Worth It: The Pros and Cons
- Easy Google Analytics 4: A Simple Guide on How It Works
If you have questions or want to join the conversation, you can also find us on X and Facebook.