Finding out where your best customers come from shouldn’t be hard. But with Google Analytics 4 (GA4), many website owners find it tough to see which traffic sources bring in actual sales.
For small businesses and online stores, this information really matters. You need to know if your customers find you through Google searches, social media, or other websites. Without this knowledge, you might be spending money on marketing that isn’t working.
That’s why I created this guide. I’ll show you how to find your best-performing traffic sources in GA4, and then share an even simpler way to track this information using OnePageGA.
Why Track Google Analytics Traffic Sources?
Every visitor to your website leaves a trail that shows how they found you. Some people click through from Google search, while others come from Facebook posts or links on other websites. Knowing these paths helps you understand what’s working in your marketing.
Let me share a personal example. On my previous website, I spent hours each week creating social media content. I was convinced social media was driving most of my traffic, after all, I was putting most of my effort there.
But when I dug into my analytics, I learned that 80% of my visitors were finding my site through Google. All that time I spent on social media was bringing in just a small fraction of my traffic.
This changed everything about how I approached my marketing. Instead of spending most of my time on social posts, I focused on creating content that would rank well in Google. My traffic grew, and I saved hours of work each week.
When you track your traffic sources, you can make smarter decisions about where to focus your efforts, just like I did. You might find that some sources bring lots of visitors, while others barely make an impact.
This knowledge helps you:
- Spend your marketing budget where it works best
- Create content that attracts more of your ideal customers
- Stop wasting time on channels that don’t bring results
- Find new opportunities to reach similar customers
Steps to Find Top-Converting Traffic Sources in GA4
Finding your converting traffic sources in GA4 takes a few steps. But don’t worry, I’ll walk you through each one with clear instructions.
Step 1. Locate Traffic Acquisition Report in Google Analytics
First, log into your Google Analytics account. Once you’re in, click on “Reports” in the left menu of your screen.
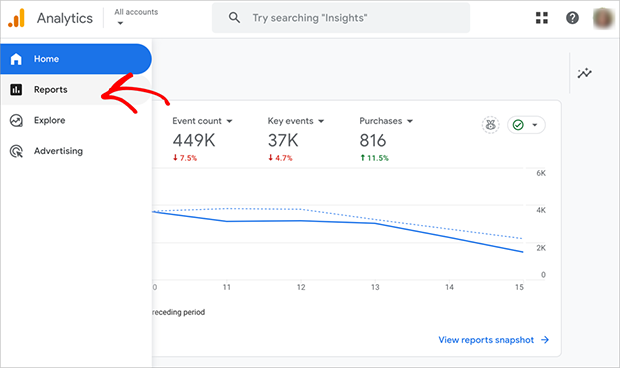
Next, look for “Life cycle” and select “Acquisition” from the options below it. You’ll then want to click on “Traffic acquisition” to open the main report.
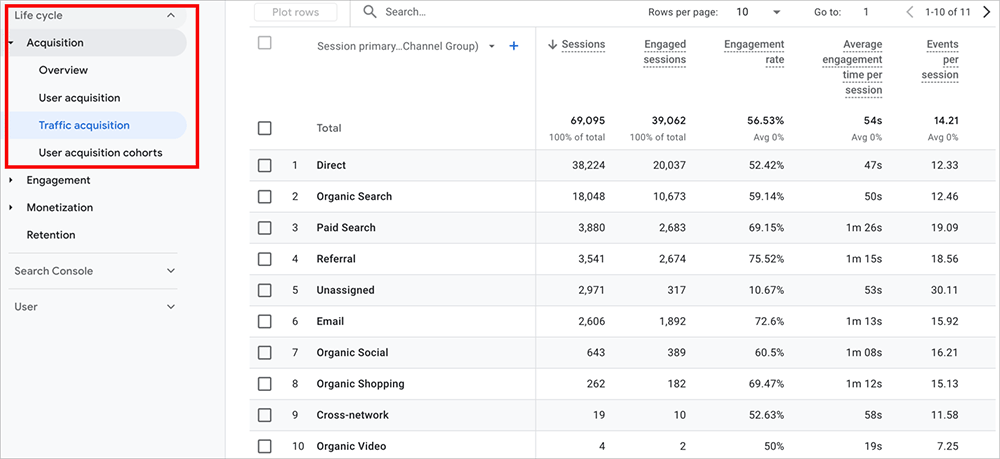
This report shows you where your website traffic comes from. You’ll see channels like “Organic Search” for Google traffic, “Paid Search” for ads, and “Social” for social media visitors.
Step 2. View Your Conversion Rate by Traffic Source
The Traffic Acquisition Report shows you a table of all your traffic sources. Each row tells you how website visitors found your website, whether through Google search, social media, or other websites.
Look for the “Events” column first. This shows you all the actions visitors take on your site.
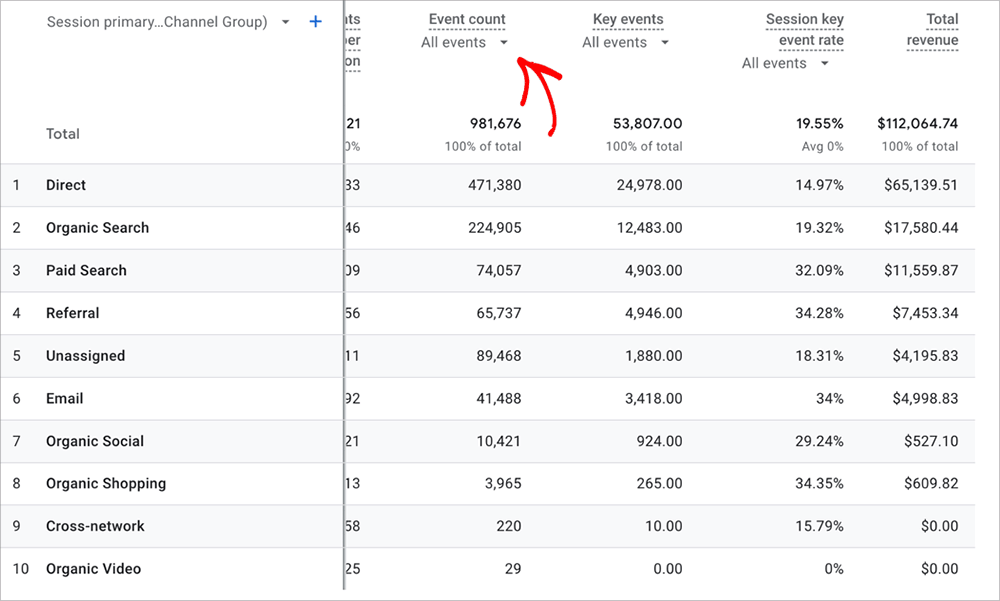
You can click the dropdown here to see specific types of events, like page views or button clicks.
Next, scroll to the right until you find the “Session key event rate” column. This number tells you how many visitors from each source take important actions on your site, like making a purchase or signing up for your newsletter.
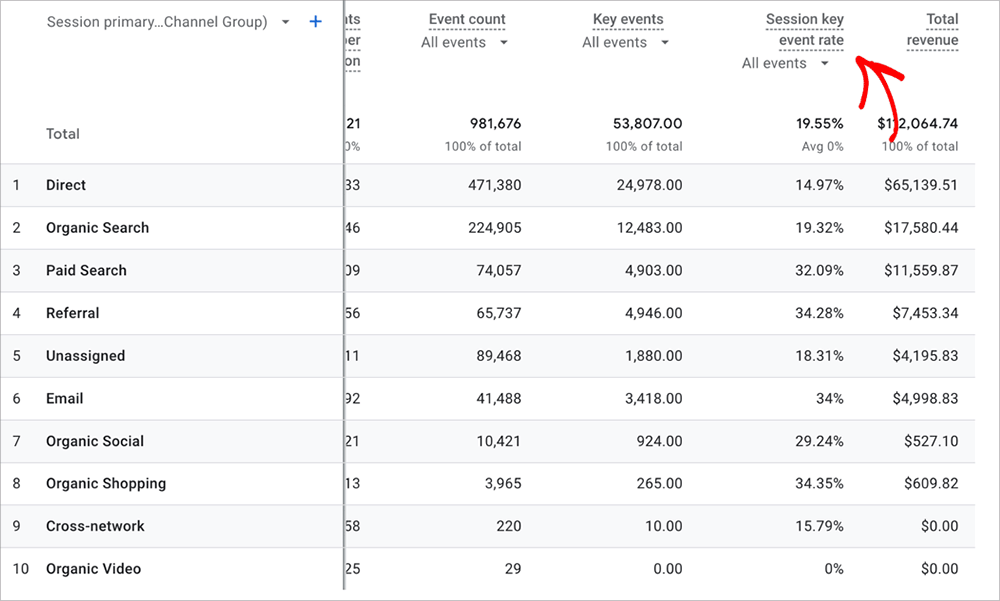
This rate is your key to understanding which traffic sources bring in the best visitors. A higher percentage means more people from that source are doing what you want them to do on your website.
If you want to quickly spot your best sources, just click the “Session key event rate” column header. This will sort them from highest to lowest.
Step 3. View Conversions by Landing Page
Now let’s go deeper and see which specific pages bring in converting visitors.
Click the plus icon in your report to customize what you’re looking at. From the dropdown menu that appears, select “Page/Screen” and then “Landing page + query string.”
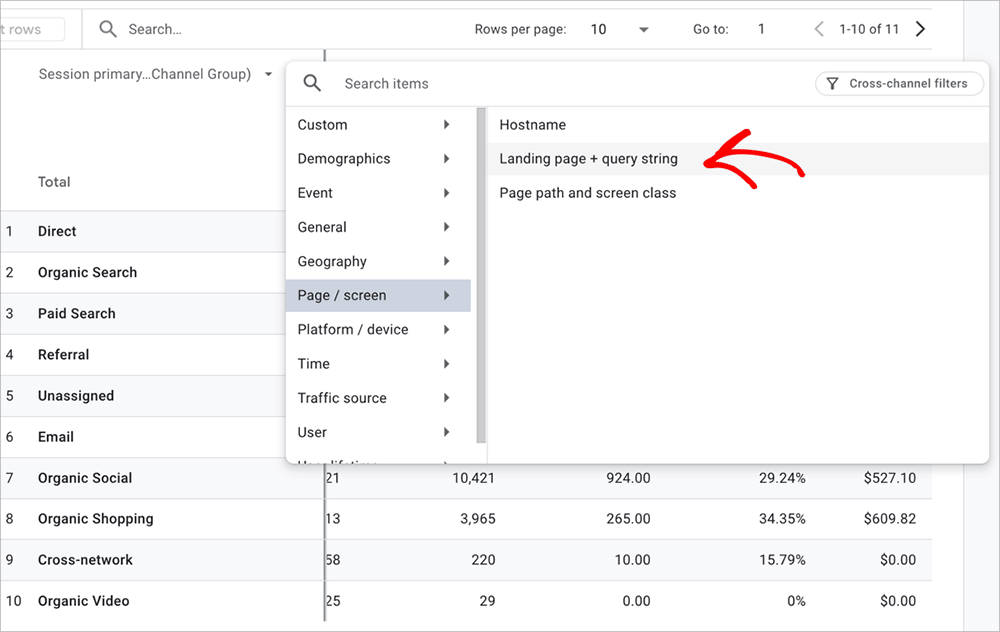
Your report will now show two columns side by side: one for the traffic source (like Direct, Organic Search, or Paid Search) and another for the landing page.
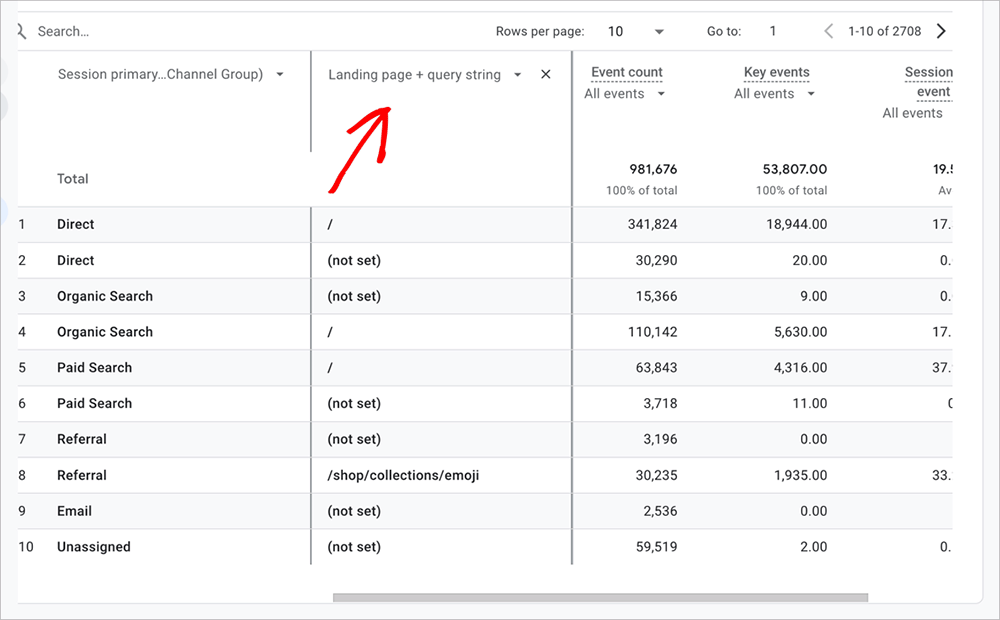
Look at the “Event count” and “Key events” columns to see how many actions visitors take on each page.
The “Session event rate” shows you which combinations of sources and pages convert best. This helps you spot your highest-performing pages for each traffic source.
Find Top-Converting Traffic Sources Using OnePageGA
Looking at all these different reports and columns in GA4 can get confusing. If you’re like most website owners, myself included, you just want to see your best traffic sources without digging through multiple reports.
OnePageGA is a simple dashboard we created to solve this problem. It connects to your Google Analytics account and pulls all your important data onto one screen.
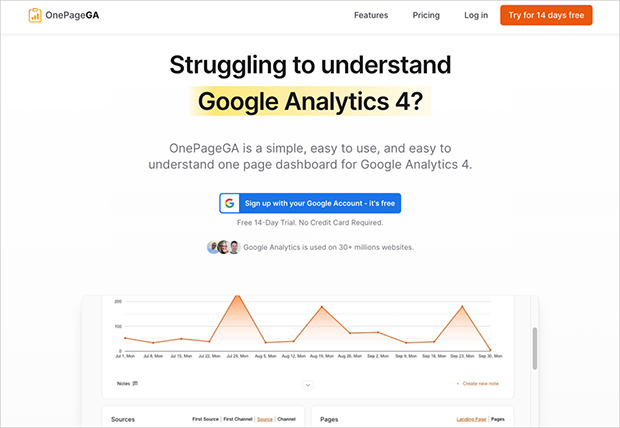
Instead of clicking through different reports and scrolling through columns, you see your top traffic sources and conversion rates instantly.
Think of it as your Google Analytics data, but organized the way you actually want to use it. No technical setup, no complex reports, just clear insights about where your best visitors come from.
Step 1. Set Up OnePageGA
Setting up OnePageGA takes just a minute.
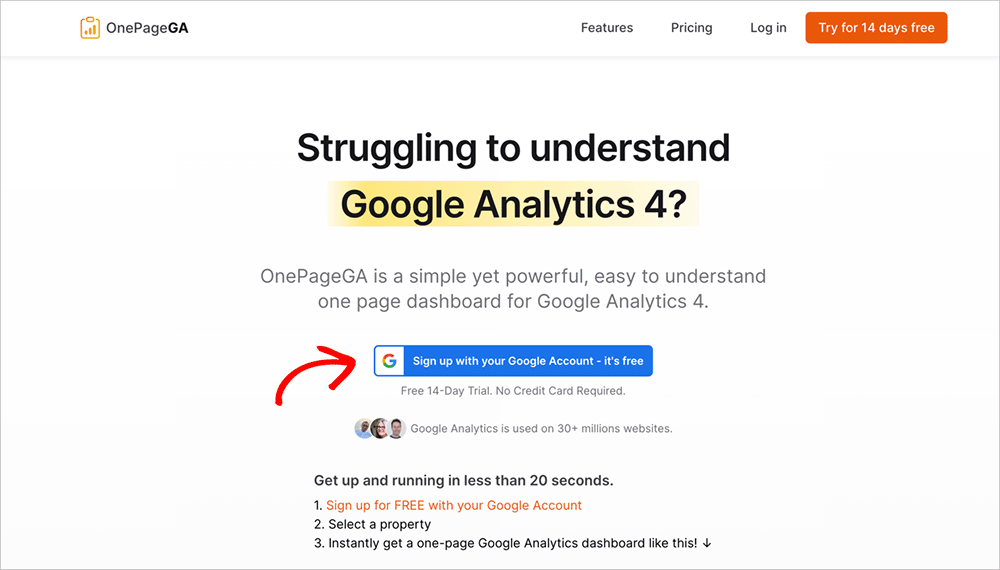
Visit onepagega.com and click the “Sign Up” button. Then connect your Google Analytics account. It’s just like signing in to any other Google service.
Step 2. View Top-Converting Traffic Sources on One Page
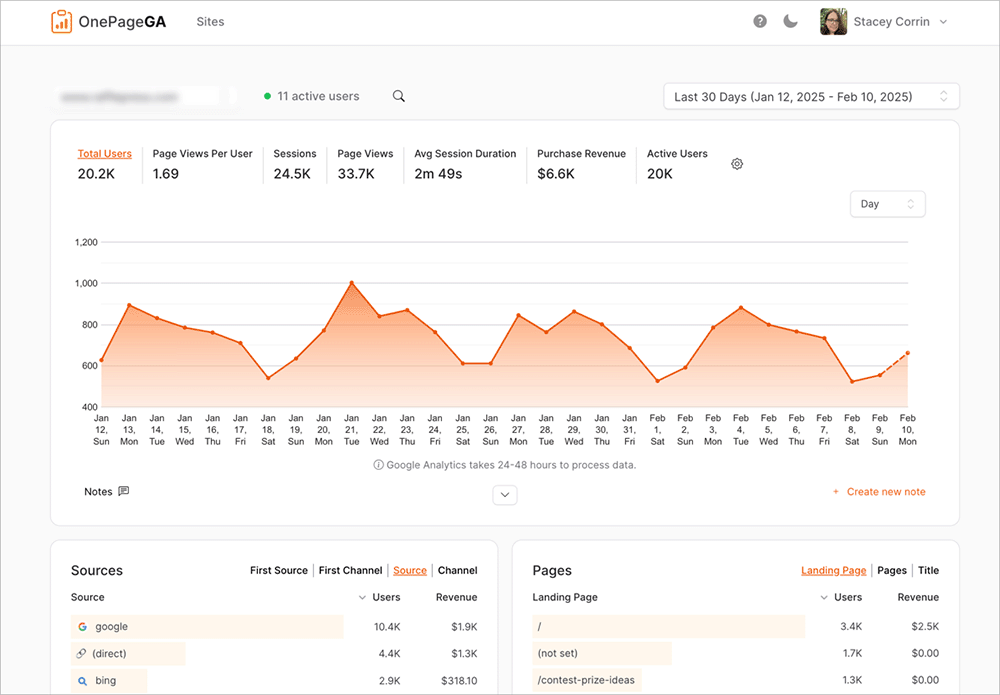
Once connected, you’ll see a pre-built dashboard at the top of your page. This shows you the essential metrics about your website’s performance right away, with no setup needed.
Confused by metrics? Find out what a metric is in Google Analytics.
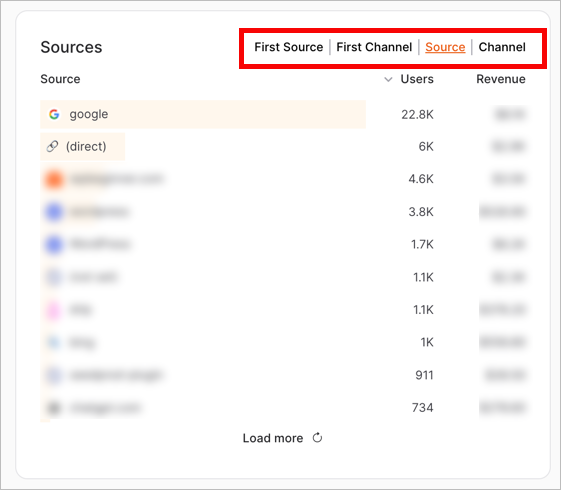
Below that, you’ll find two simple reports side by side. The Sources report shows where your visitors come from, along with key metrics like users and revenue.
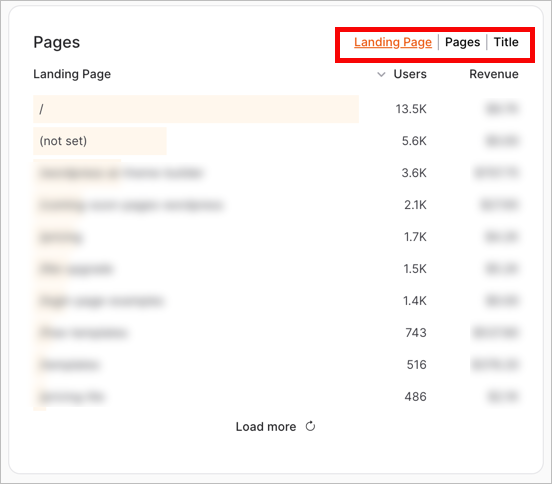
The Pages report shows which landing pages bring in the most traffic and value.
Each report comes with powerful filtering options. In the Sources report, you can filter by Channel, Source, First Source, or First Channel.
The Pages report lets you filter by Landing Page, Pages, or Title. This helps you zoom in on exactly what you want to see.
If you need more detailed data, click “Load more” at the bottom of either report. This opens a sidebar with a complete list of your sources or pages, plus a search bar to find specific entries quickly.
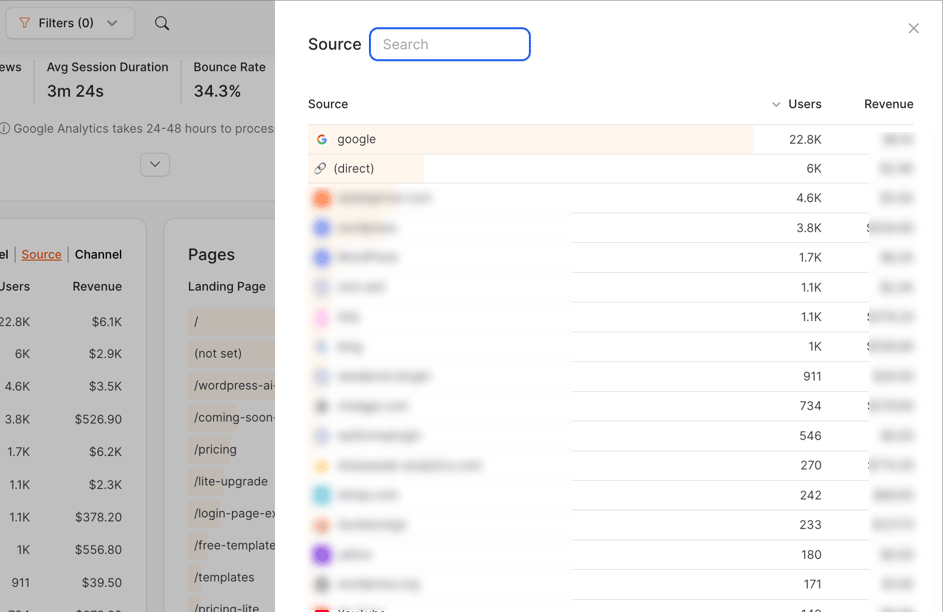
That’s all there is to it. Everything you need to understand your traffic sources is right there on one page, updated in real-time.
Take Control of Your Traffic Analytics
Knowing where your best traffic comes from is one of the best ways to make data-driven decisions about your business. While GA4 is powerful, it’s also overwhelming for a lot of users. There’s so much detail to absorb and it takes time to fully understand.
With OnePageGA, analytics is much simpler. You get all the detailed tracking you need, presented in a way that’s easy to understand and act on.
Start by exploring your traffic sources in GA4 using the steps above. Then, when you’re ready for simpler analytics, sign up for a 14-day free trial of OnePageGA.
After all, knowing where your best visitors come from shouldn’t require a degree in data analysis.
If you’re looking for more ways to understand your website’s traffic, see our other guides and resources:
- What Is a User in Google Analytics?
- Mistakes to Avoid When Choosing Top Web Analytics Tools
- How to Create Simple Google Analytics Reports
- Types of Web Analytics Every Website Owner Should Know
- How to Add Google Analytics to Your Website
- Easy Google Analytics 4: A Simple Guide on How It Works
If you have questions or want to join the conversation, you can also find us on X and Facebook.
