Every click, scroll, and pause a visitor makes on your website tells a piece of a story. User behavior analytics tools help you see that full story instead of just the summary.
For a long time, I focused only on that summary, which left me guessing about the plot. I wanted to understand the full narrative of a person’s journey on my site.
This is where user behavior analytics tools completely changed the game for me. They let you see the detailed story of each visit as it unfolds.
Instead of just a number, you get to see a path. You learn what caught their eye and what might have caused a moment of hesitation.
I’m going to walk you through my favorite tools for this. They’ll help you read these valuable stories and connect more deeply with your visitors.
Compare the Top User Behavior Analytics Tools
Here’s a quick side-by-side look at the tools I’ll be covering below. You can compare pricing and who each tool is best for at a glance.
| Tool | Pricing | Free Plan? | Best For |
|---|---|---|---|
| Google Analytics (GA4) | Free | Yes | General site traffic and attribution |
| OnePageGA | From $10/month | Yes | Simple GA4 dashboards |
| Microsoft Clarity | Free | Yes | Free heatmaps and recordings |
| Hotjar | Free plan, paid from $32/month | Yes | Feedback + behavior analytics |
| Crazy Egg | From $29/month | 30-day trial | Heatmaps + A/B testing |
| FullStory | Custom | Yes | Debugging and detailed session data |
| Mixpanel | Free plan, custom | Yes | SaaS funnels + retention |
| Amplitude | Free plan, paid from $49/month | Yes | Advanced journey analytics |
| Heap | Free plan, contact for pricing | Yes | Auto-tracking all events |
| Lucky Orange | Free plan, paid from $32/month | Yes | Ecommerce sites needing live chat |
What Are User Behavior Analytics Tools?
User behavior analytics tools help you understand how people actually interact with your site. Instead of just showing numbers like total users or pageviews, these tools track the actions that make up each visit.
You can see:
- Clicks on buttons, links, or images
- How far someone scrolls down a page
- Rage clicks (when someone clicks over and over out of frustration)
- Where users abandon forms
- Full session recordings of a visit
- Funnels and paths that show the steps people take
This is different from standard analytics, which summarize traffic and conversions at a higher level. User behavior analytics tools focus on why things happen. They help you spot problems, fix design issues, and create better user experiences without guessing.
For more info on the differences, see my guide on the types of website analytics available.
How I Chose The Best User Behavior Analytics Tools
I wanted this list to be genuinely helpful, so I focused on tools that work well for beginners and small teams. Every option I included met these criteria:
- Beginner-friendly: You don’t need to be a developer to use them.
Clear visual reports: Heatmaps, funnels, and recordings that are easy to understand at a glance. - Affordable or free plans: Tools that fit most budgets without cutting essential features.
- Trusted performance: Either tested by me or widely recommended by site owners I trust.
These are the tools I’d feel confident using on any of my own websites.
Best User Behavior Analytics Tools
Now that you know what these tools do and how I chose them, let’s look at the ones I recommend most.
Some are simple and free. Others offer deeper insights if you want to invest a little more. I’ve organized them so you can start with the most essential options and work your way down, depending on what you need.
1. Google Analytics
| Pricing: Free |
| Free Plan / Trial: Yes |
| Standout Features: |
| 🔹 Real-time traffic data 🔹 Traffic source tracking 🔹 Conversion and event reporting |
| Rating: A |
| Best For: General site traffic and marketing attribution |
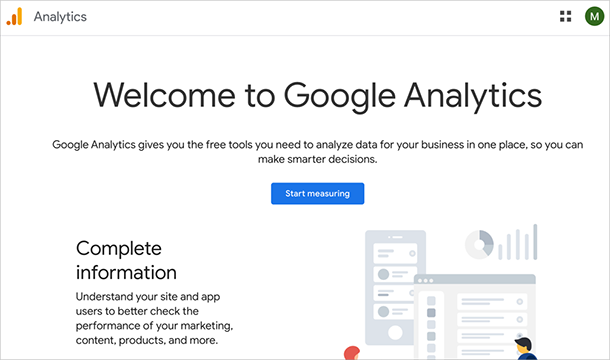
Google Analytics (GA4) is where I start with every site I work on. It gives me the big picture: how much traffic I’m getting, where it’s coming from, and which pages are pulling their weight.
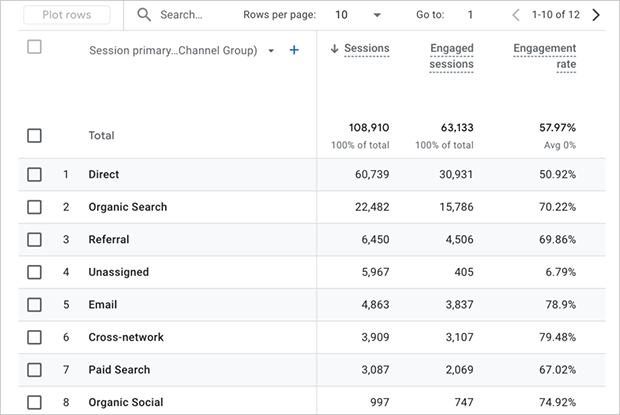
One feature I use constantly is the Traffic Acquisition report. It shows me which channels (search, social, email, etc.) are driving visitors so I can double down on what’s working.
I also like being able to set up events to track conversions and micro-actions like form submissions or video plays.
The downside? GA4 can feel overwhelming. There are dozens of reports, and it’s easy to get lost if you only want a quick read on user behavior. That’s why I often pair it with simpler tools (like OnePageGA) to surface the insights I care about most.
Pros:
- Free and powerful
- Integrates with most platforms
- Excellent for tracking conversions and sources
Cons:
- Steep learning curve for beginners
Limited visuals for click or scroll behavior
Verdict: GA4 is the foundation for understanding your audience. Use it for traffic trends and marketing attribution, then layer on other tools from this list for deeper behavior insights.
See my guide to learn how to set up Google Analytics on your website.
2. OnePageGA
| Pricing: Starts at $10/month |
| Free Plan / Trial: Free plan available |
| Standout Features: |
| 🔹 Single-page GA4 dashboard 🔹 Customizable metrics 🔹 Easy engagement and funnel insights |
| Rating: A |
| Best For: Simplifying GA4 behavior tracking |
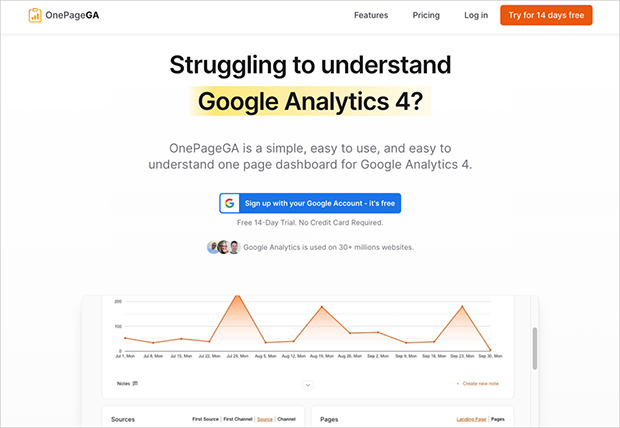
OnePageGA is the tool I use when I want my GA4 data to make sense fast. It pulls in your Google Analytics data and organizes it on a single, clean dashboard. No more digging through reports to figure out which pages are holding people’s attention and which ones are losing them.
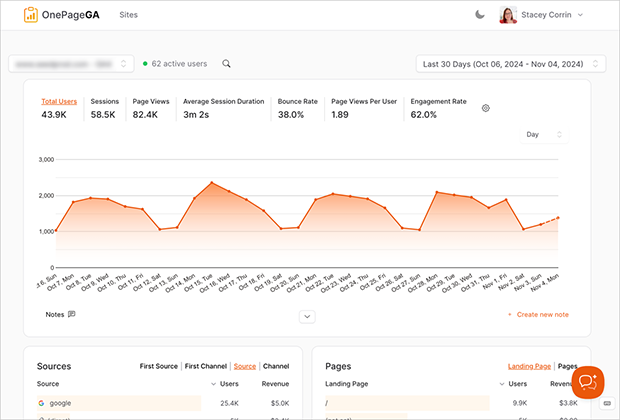
I like that I can toggle on specific metrics, like average session duration or engagement rate, and immediately see how they trend over time. This makes it much easier to catch problems early, like a sudden drop in scroll depth on a key page.
The interface feels approachable, even if you don’t know GA4 inside and out. But because it’s tied to GA4, you still have access to the depth of data if you want it.
Pros:
- Turns GA4 data into clear, simple visuals
- Shows engagement and funnel performance without custom setups
- Works great for small sites and busy teams
Cons:
- Only works with GA4 data
- Doesn’t include session replays or heatmaps
Verdict: If GA4 makes your head spin, OnePageGA is the fastest way to actually understand your user behavior data. It surfaces the insights you need in minutes instead of hours.
Here’s a guide on how OnePageGA’s easy Google Analytics works.
3. Microsoft Clarity
| Pricing: Free |
| Free Plan / Trial: Yes |
| Standout Features: |
| 🔹 Unlimited session recordings 🔹 Heatmaps for clicks and scrolls 🔹 Frustration signals (rage clicks, dead clicks) |
| Rating: A |
| Best For: Free heatmaps and session replays |
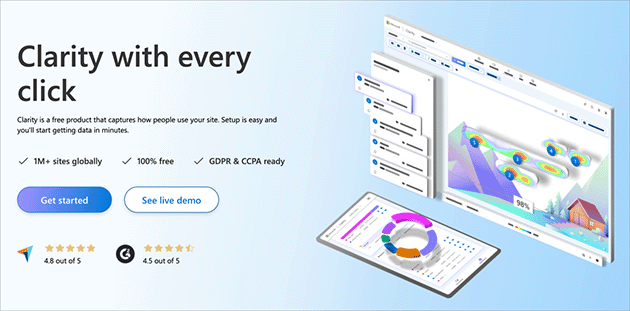
Microsoft Clarity is the first behavior analytics tool I recommend to anyone on a budget because it’s completely free, and surprisingly powerful.
I use it to watch session recordings, which show exactly how someone moved through a page. It’s amazing how quickly you can spot issues this way, like users repeatedly clicking on something that isn’t clickable or bailing halfway through a form.
The built-in heatmaps are also helpful. They show me which parts of a page get attention and which get ignored, so I know where to place my most important content or calls-to-action.
There’s no limit on the number of sessions you can track, which is rare for a free tool. The trade-off is that Clarity doesn’t have deep funnels or advanced integrations.
Pros:
- Completely free with no limits
- Heatmaps and recordings are easy to use
- Highlights frustration signals automatically
Cons:
- Lacks advanced reporting
No direct eCommerce tracking
Verdict: If you want to start understanding user behavior today without spending a cent, Microsoft Clarity is your best bet.
4. Hotjar

| Pricing: Free plan available, paid plans start at $32/month |
| Free Plan / Trial: Yes |
| Standout Features: |
| 🔹 Heatmaps and session replays 🔹 On-site feedback polls 🔹 Survey tools for direct user input |
| Rating: A- |
| Best For: Tracking user sessions with feedback tools |
Hotjar is one of the most well-known user behavior analytics tools, and for good reason. It combines heatmaps, session replays, and user feedback tools in one platform.
I’ve used Hotjar’s on-site surveys to ask visitors why they didn’t complete a signup form, and the answers were eye-opening. Pairing that direct feedback with the heatmaps and recordings makes it easy to figure out why people leave a page or where they get stuck.
The free plan is solid for smaller sites, but you’ll hit limits on the number of recordings pretty quickly. The paid plans open up more data and features like advanced targeting for surveys.
Pros:
- Combines visual behavior data with user feedback
- Heatmaps and recordings are intuitive
- Surveys and polls can run directly on your site
Cons:
- Free plan is limited
- Pricing can add up for larger sites
Verdict: Hotjar is a great all-in-one option if you want to combine behavioral data with user feedback to get the full picture.
5. Crazy Egg
| Pricing: Paid plans start at $29/month |
| Free Plan / Trial: 30-day free trial |
| Standout Features: |
| 🔹 Click and scroll heatmaps 🔹 Session recordings 🔹 Built-in A/B testing |
| Rating: B+ |
| Best For: Click and scroll heatmaps |
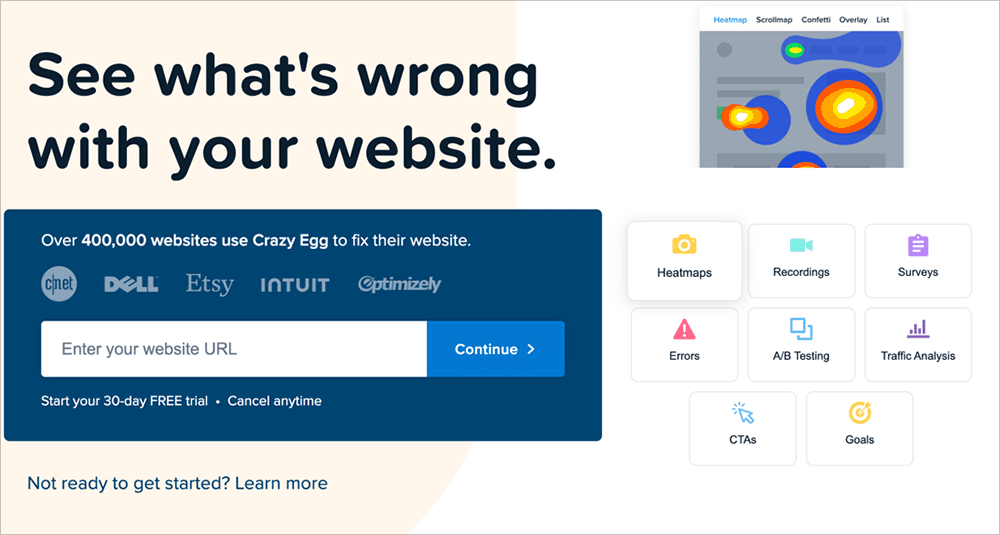
Crazy Egg is one of the easiest ways to add heatmaps and scroll maps to your site. I’ve used it to quickly see which elements get the most clicks and how far users are making it down a long page.
One feature I like is the built-in A/B testing. You can make small design tweaks, like changing a button color or moving a form higher, and see which version performs better without needing a separate tool.
The interface is straightforward, but Crazy Egg doesn’t go as deep as some of the others when it comes to funnels or advanced reporting. It’s best for quick, visual insights.
Pros:
- Simple to set up and use
- Heatmaps and scroll maps are clear and detailed
- Includes basic A/B testing
Cons:
- Limited analytics beyond heatmaps
- Paid plans only (beyond free trial)
Verdict: Crazy Egg is a solid choice if you want fast, visual insights about where people click and how far they scroll.
6. FullStory
| Pricing: Custom pricing (free plan available) |
| Free Plan / Trial: Yes |
| Standout Features: |
| 🔹 High-fidelity session replays 🔹 Debugging tools for developers 🔹 Advanced funnel and retention analysis |
| Rating: A- |
| Best For: Digital experience insights and debugging |
FullStory is the tool I reach for when I want the most detailed look at how users experience a site. Its session replays are incredibly high quality. You can see every movement, click, and scroll almost exactly as the user saw it.
I’ve used FullStory’s error tracking to uncover bugs that would have been impossible to spot with other tools. It captures console errors and network issues alongside the session recording, so you can see what went wrong from both the user’s and the developer’s perspective.
The analytics side is also strong. You can build funnels, filter by user behavior, and analyze retention trends in detail. It’s more than most small sites need, but larger businesses and SaaS companies will appreciate the depth.
Pros:
- Extremely detailed session replays
- Powerful debugging tools for developers
- Advanced funnels and retention analytics
Cons:
- Pricing is custom and can get expensive
- Too advanced for very small sites
Verdict: If you need enterprise-level insights and debugging, FullStory is hard to beat. It gives you both the “what” and the “why” behind user behavior.
7. Mixpanel
| Pricing: Free plan available, custom pricing |
| Free Plan / Trial: Yes |
| Standout Features: |
| 🔹 Detailed funnel and retention tracking 🔹 Cohort analysis for user segments 🔹 Real-time dashboards |
| Rating: A- |
| Best For: SaaS and product teams tracking retention and funnels |
Mixpanel is a great solution for product analytics. If you run a SaaS app or any site where user retention is key, its event-based tracking is invaluable. You can see exactly how users move through a funnel, which features they use most, and when they drop off.
I’ve used Mixpanel’s cohort analysis to spot patterns in churn. For example, I discovered that users who didn’t complete onboarding within the first 48 hours rarely came back. That insight helped me redesign the onboarding flow and boost retention.
The free plan is generous, but you’ll need a paid plan for more data history and advanced features. It’s also a bit more technical to set up compared to other tools on this list.
Pros:
- Excellent for tracking user journeys over time
- Cohort analysis gives actionable retention insights
- Real-time dashboards keep you updated
Cons:
- Learning curve for beginners
- Paid plans required for deeper data and features
Verdict: Mixpanel is perfect if you’re serious about understanding user retention and behavior in depth, especially for SaaS or product-based businesses.
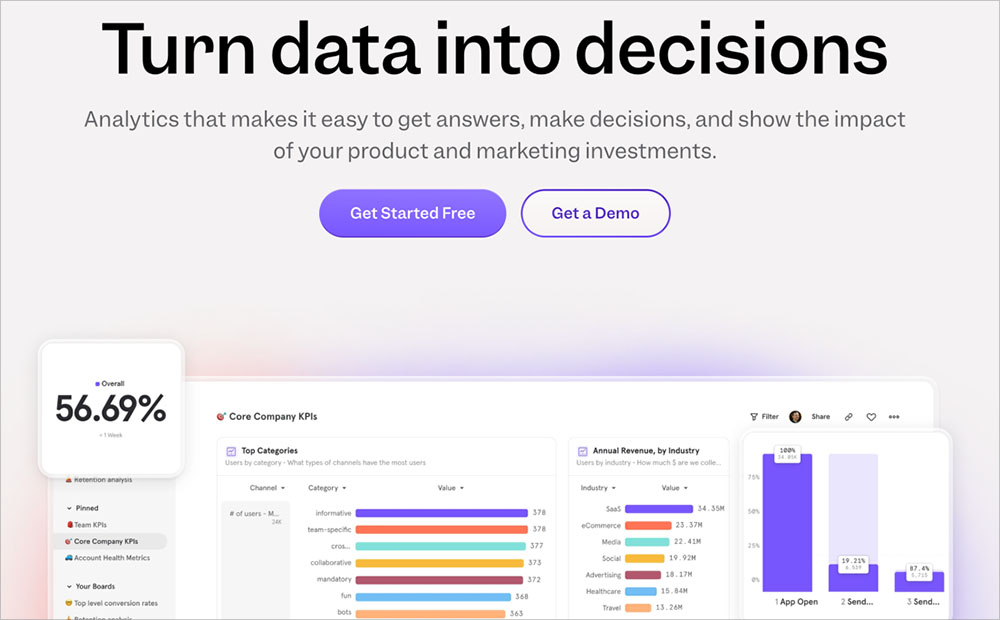
8. Amplitude
| Pricing: Free plan available, paid plans start at $49/month |
| Free Plan / Trial: Yes |
| Standout Features: |
| 🔹 Journey analysis at scale 🔹 Advanced funnel and retention reports 🔹 Predictive analytics for user behavior |
| Rating: A |
| Best For: Journey and retention analytics at scale |
Amplitude is a popular choice for teams that need advanced journey and retention analytics. While I’ve only tried the platform briefly, it’s easy to see why product-focused companies use it.
Its journey analysis tools let you visualize how users move through your product or site step by step. You can also build detailed funnels and retention reports to understand where people drop off and which actions lead to long-term engagement.
One standout feature is its predictive analytics, which can help you identify which users are most likely to convert or churn. This allows you to act before you lose customers, something many analytics tools can’t do.
Pros:
- Extremely detailed journey and retention analysis
- Predictive analytics for proactive action
- Scales well for larger products and teams
Cons:
- Can be complex for small teams or basic use cases
- Pricing can climb as you grow
Verdict: Amplitude is worth exploring if you’re running a growing product or app and want enterprise-level insights, but it’s probably more than you need for a simple website.
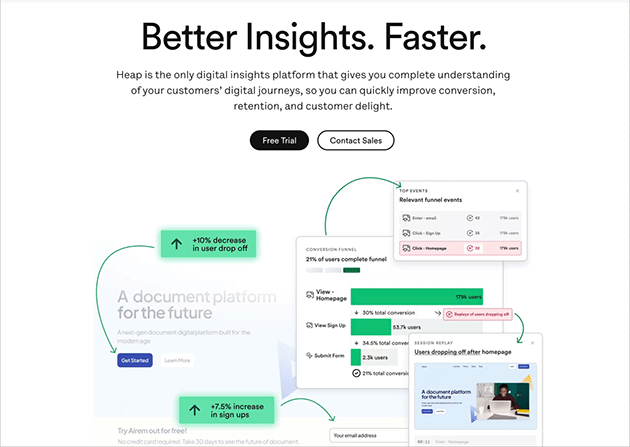
9. Heap
| Pricing: Free plan available, contact for pricing |
| Free Plan / Trial: Yes |
| Standout Features: |
| 🔹 Auto-captures every user action 🔹 Retroactive funnel and cohort analysis 🔹 Detailed user journey mapping |
| Rating: A- |
| Best For: Auto-tracking user behavior across funnels and journeys |
Heap is different from most tools because it automatically tracks every user action on your site or app. This includes clicks, taps, form submissions, you name it. You don’t have to set up events ahead of time.
I’ve found this auto-capture feature really useful when I want to analyze behavior I hadn’t thought about tracking before. For example, I was able to go back and see how many users clicked a non-essential element during onboarding and if that affected completion rates, without ever setting up a manual event.
Heap’s retroactive analysis is another big win. You can build funnels and segments after the fact and still get the full data picture. The trade-off is that it can feel like overkill for smaller sites with limited data.
Pros:
- Tracks all user actions automatically
- Retroactive analysis makes it flexible
- Excellent for detailed journey mapping
Cons:
- Pricing is higher than some alternatives
- Can feel complex for small sites
Verdict: Heap is a great option if you want to capture everything users do and dig into advanced funnels and cohorts later on.
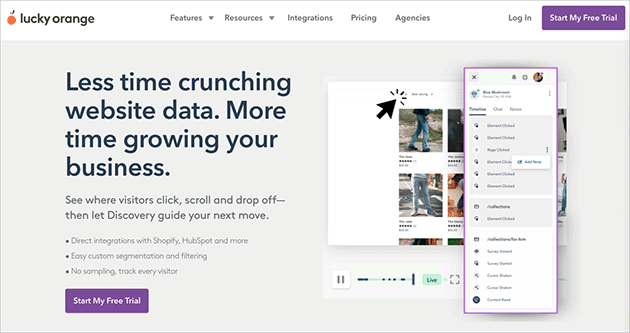
10. Lucky Orange
| Pricing: Free plan available, paid plans start at $32/month |
| Free Plan / Trial: Yes |
| Standout Features: |
| 🔹 Heatmaps and session recordings 🔹 Live chat and surveys built-in 🔹 Conversion funnels and visitor profiles |
| Rating: B+ |
| Best For: Ecommerce sites that want live chat + heatmaps in one tool |
Lucky Orange is a good all-in-one option if you want behavior analytics and live chat in the same tool. I like that it includes heatmaps, session recordings, and conversion funnels alongside features like surveys and real-time chat.
This makes it especially useful for ecommerce sites. You can watch where customers are dropping out of the checkout funnel and then use live chat to nudge them back before they leave.
It’s not as polished as Hotjar or Microsoft Clarity on the behavior side, but the built-in engagement tools give it an edge if you want to talk directly to your visitors.
Pros:
- Combines heatmaps, recordings, and chat in one platform
- Funnels help identify checkout or form drop-offs
- Affordable for the feature set
Cons:
- Interface can feel cluttered
- Behavior analytics features aren’t as deep as standalone tools
Verdict: Lucky Orange is worth a look if you run an ecommerce site and want to reduce abandoned carts with real-time support and feedback.
Bonus: MonsterInsights for WordPress Users
If your site runs on WordPress and you want an easier way to see your GA4 reports, MonsterInsights is worth a look. It pulls Google Analytics data right into your WordPress dashboard, so you don’t need to log into GA4 separately.
It’s not a full user behavior analytics tool, so you won’t get heatmaps or session replays, but it’s a great add-on if you want quick access to your core metrics.
What’s the Best User Behavior Analytics Tool for You?
If you just need a clear way to understand GA4, OnePageGA is the fastest way to see your key metrics on a single dashboard.
Microsoft Clarity is the strongest free option, especially if you want heatmaps and session recordings. If surveys and polls matter too, Hotjar or Lucky Orange combine those with behavioral data.
Crazy Egg is ideal for testing landing pages and layouts with quick A/B tests.
And if you’re running a SaaS or product-focused site, Mixpanel, Amplitude, and Heap will give you the deepest funnel and retention insights. For debugging alongside replays, choose FullStory.
Start with the tool that matches your biggest goal, then add others as your needs grow.
FAQs About User Behavior Analytics
What’s the difference between Google Analytics and Hotjar?
Google Analytics (GA4) shows you high-level traffic data and conversions, while Hotjar focuses on user behavior. With Hotjar, you can see heatmaps, session replays, and run surveys to understand why visitors act a certain way.
Can I use user behavior analytics tools with GA4?
Yes. Most behavior analytics tools work alongside GA4. GA4 gives you the big picture, and behavior tools like OnePageGA, Clarity, or Hotjar add deeper insight into user actions.
What metrics can user behavior tools track?
They can track clicks, scroll depth, form drop-offs, rage clicks, session recordings, and user journeys through funnels. These metrics help you see where people engage and where they get stuck.
Can I use heatmaps on mobile devices?
Yes. Most tools, including Hotjar, Microsoft Clarity, and Crazy Egg, generate separate heatmaps for mobile, tablet, and desktop traffic.
Are user behavior analytics tools worth it for small sites?
Absolutely. Even a small number of visitors can reveal patterns that help you improve your site. Tools like Microsoft Clarity and OnePageGA are great starting points because they’re free or affordable.
Get Started with User Behavior Analytics
If you want to understand how people really use your site, these user behavior analytics tools will get you there.
I recommend starting with OnePageGA if GA4 feels overwhelming. It turns your analytics into a simple, single-page dashboard, so you can focus on what matters most.
From there, you can add tools like Microsoft Clarity or Hotjar for heatmaps and session recordings or Mixpanel and Heap for deeper funnel and retention analysis.
Want to keep learning? Check out these related guides:
- Best Ecommerce Analytics Tools
- Top Web Analytics Tools
- Engagement Rate vs Bounce Rate in GA4
- What Is a Metric in Google Analytics (And What to Track)
If you have questions or want to join the conversation, you can also find us on X and Facebook.
